Article Overview
The article describes the reporting capabilities of EasySend's platform. It details the difference between detailed and overview reports in addition to describing how to access and create them. The article also explains how to perform reports-related troubleshooting.
Reports and Analytics
The EasySend platform allows EasySend’s customers to create and view standard and customized periodic detailed tracking reports for business results and operations analysis. Customers can also create overview analytics reports that provide an overview of how digital processes are performing. This includes information on how many sessions were created, opened, and completed.
Detailed Reports Overview
Detailed reports are transaction-level reports aimed at reviewing specific transaction statuses or analyzing customer inputs in an aggregated manner.
The reports are typically used to assist customer-facing teams to view customer-specific information or the ‘status’ of the EasySend transaction.
The information in the reports is composed of user input fields and metadata fields.
How to Navigate to the Detailed Reports Screen?
(See Figure 1 to Figure 3)
To navigate to the Detailed Reports screen, perform the following steps:
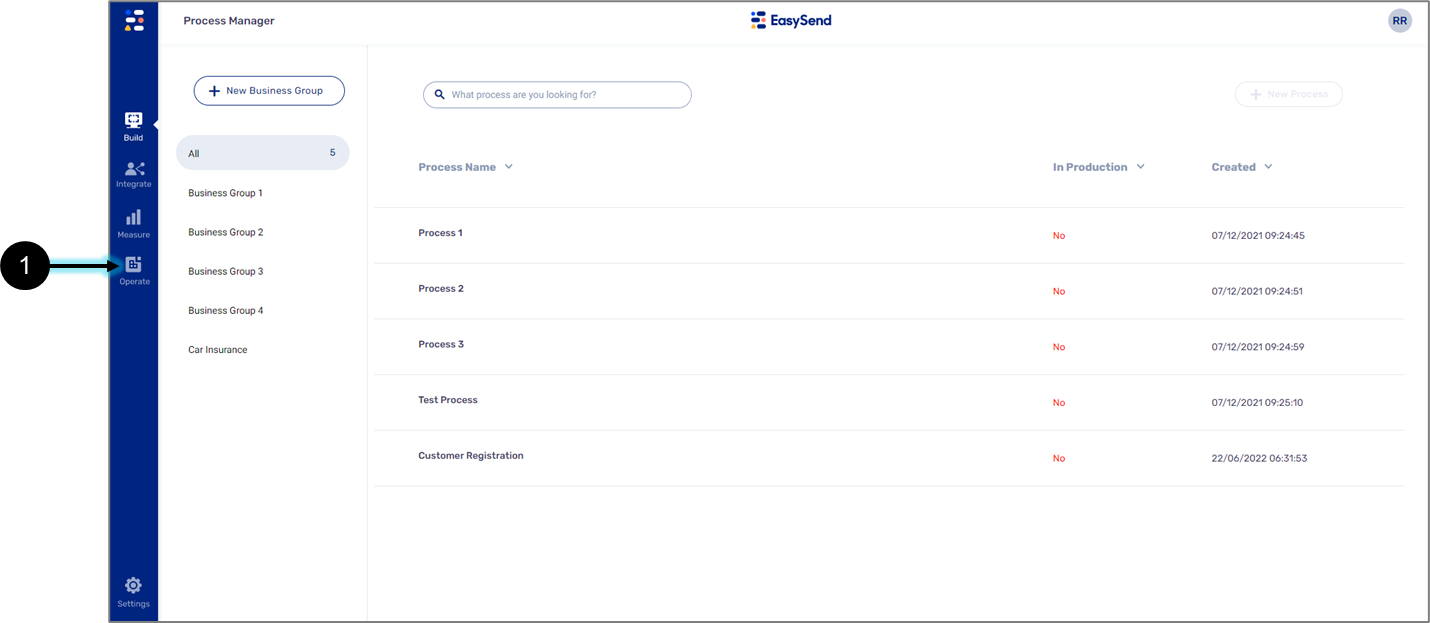
Figure 1: Operate Tab
- Click the Operate tab (1).
Result:
The Operate tab options appear:
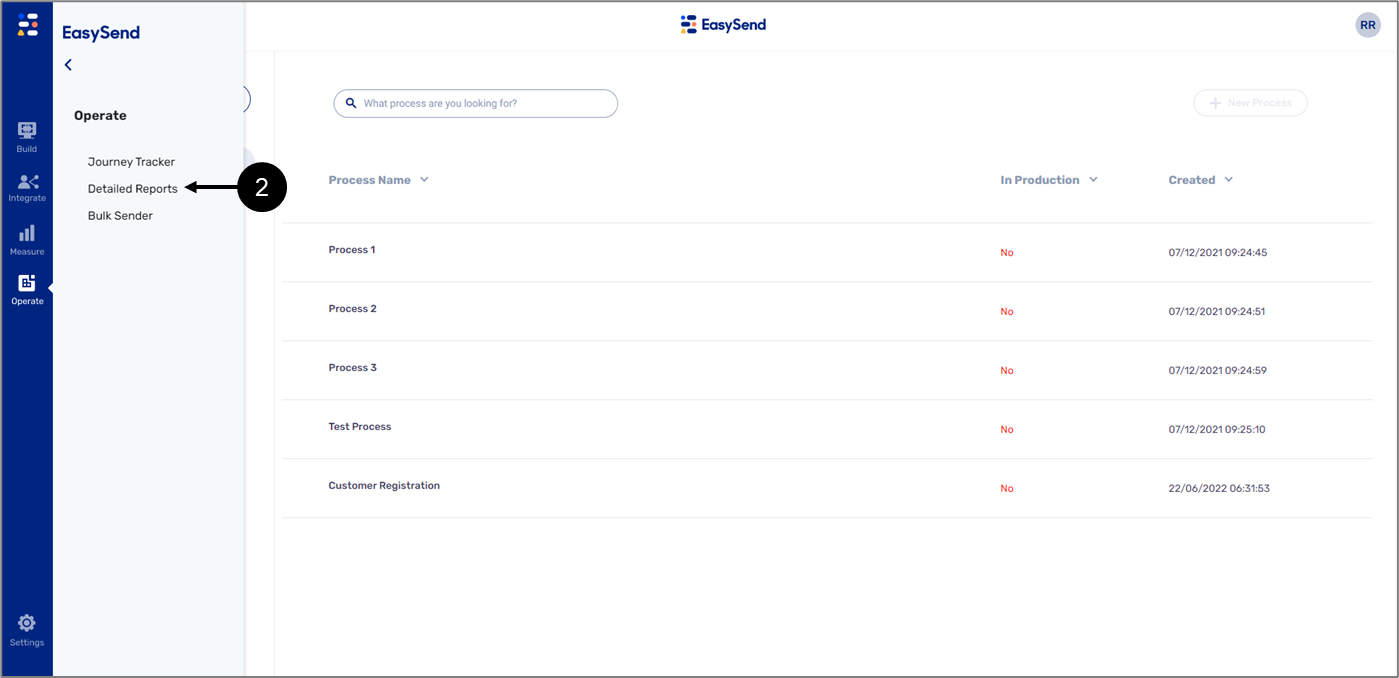
Figure 2: Detailed Reports Option
- Click the Detailed Reports option (2).
Result:
The Detailed Reports screen appears:
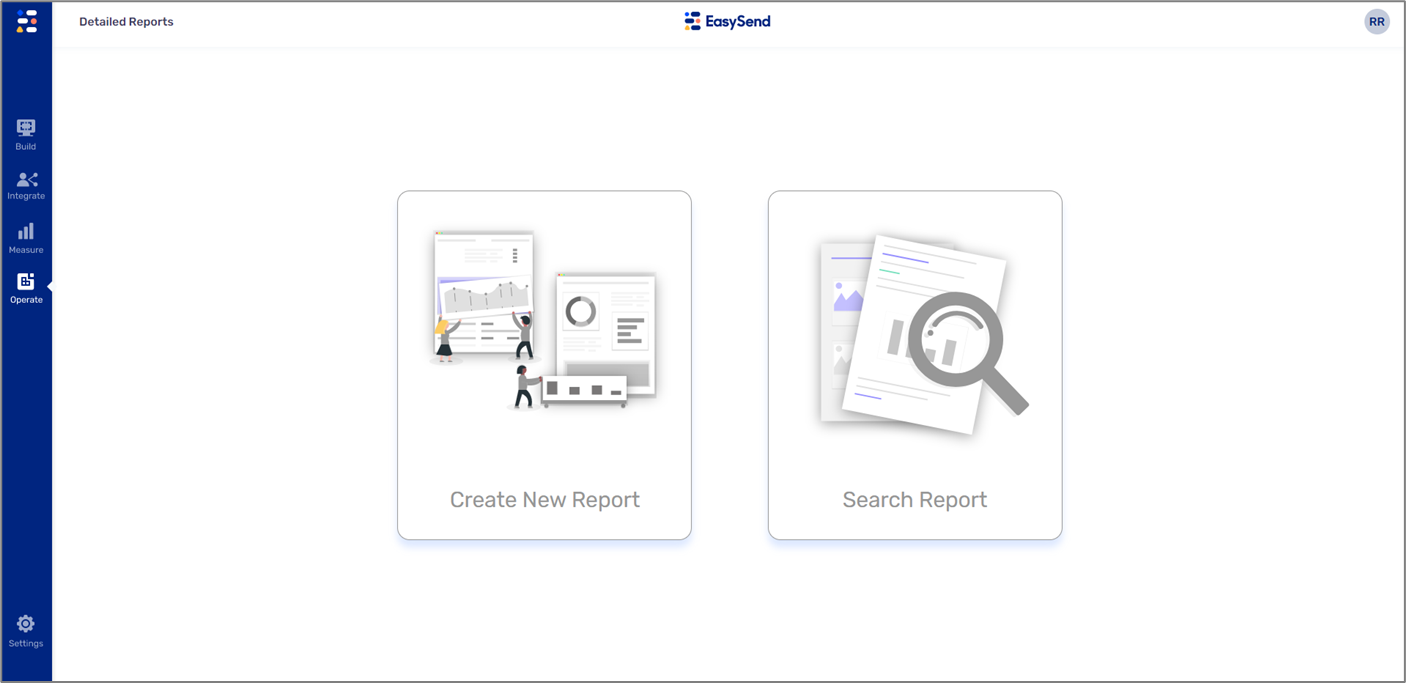
Figure 3: Detailed Reports Screen
Detailed Reports Screen
The Detailed Reports screen contains two options:
- Create a New Report
- Search Reports
Create New Report - Tracking Report Screen
Clicking the Create New Report option displays the Tracking Edit Report screen. Figure 4 and Table 1 describe its structure.
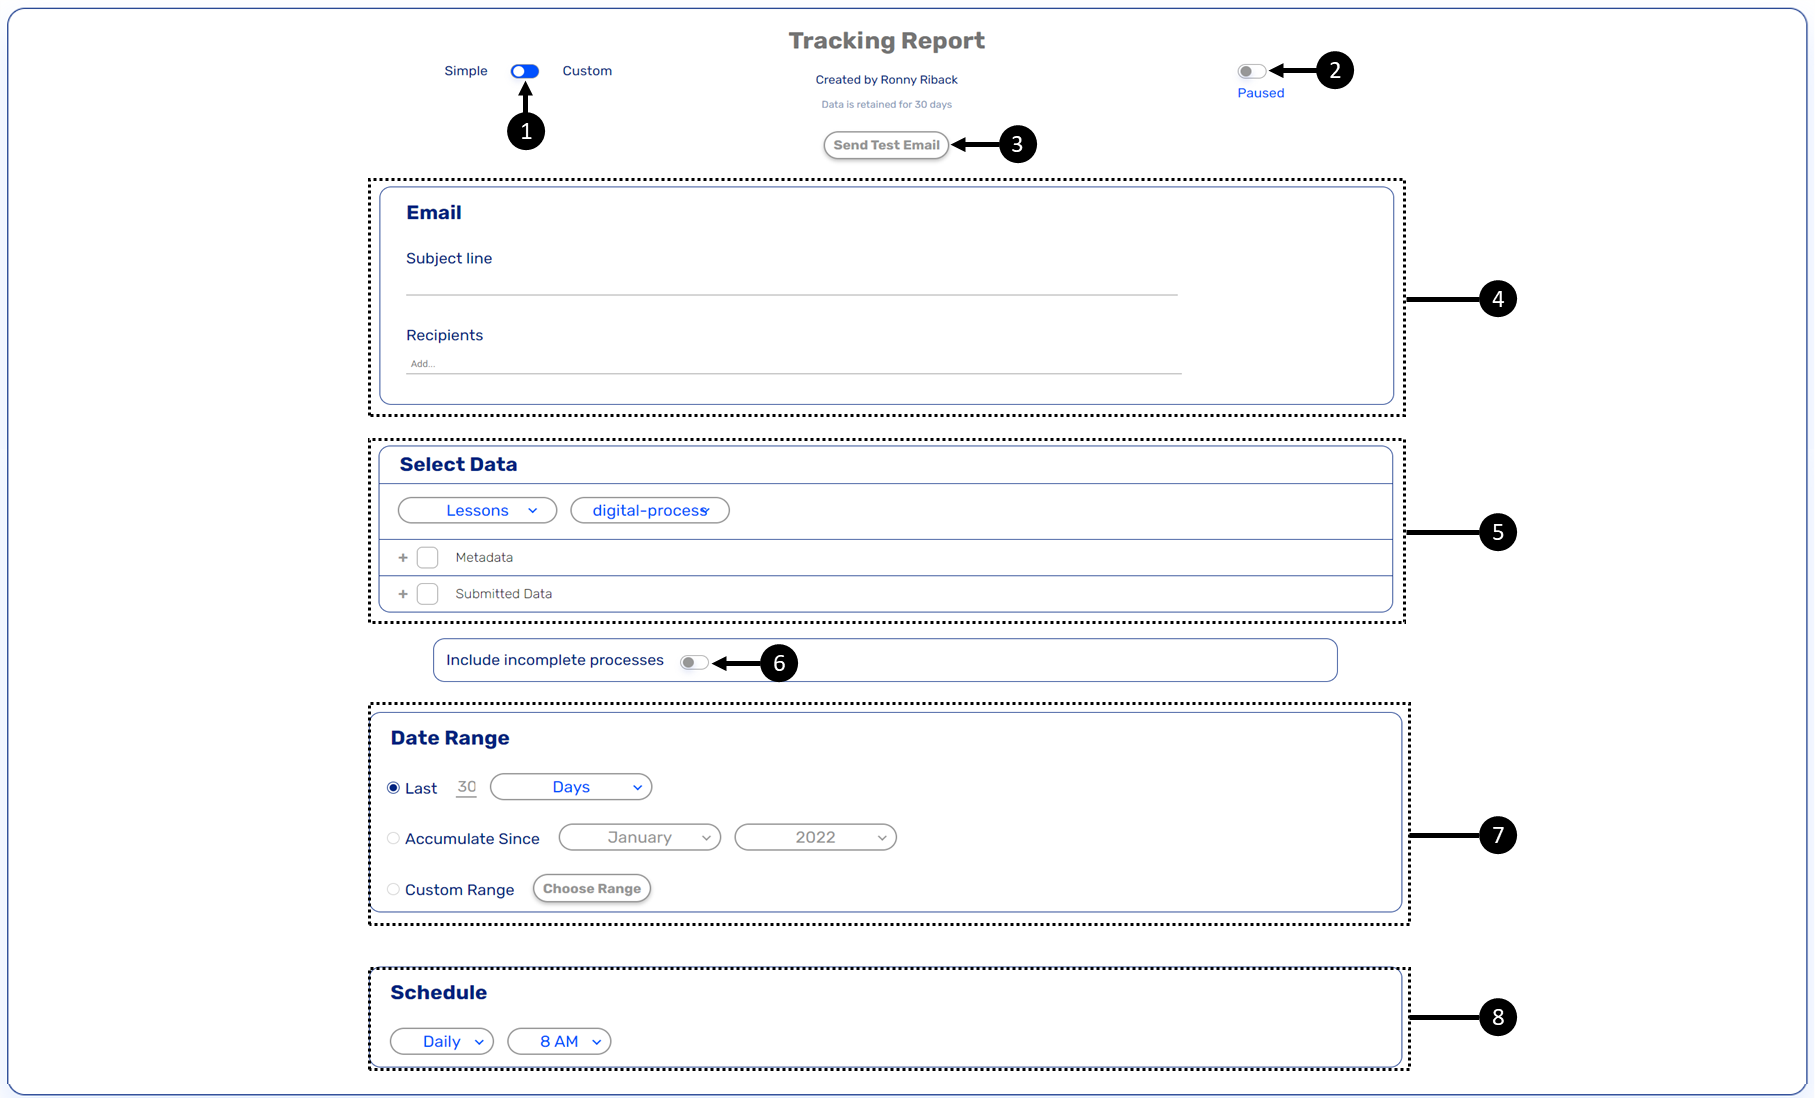
Figure 4: Tracking Report Screen
Table 1: Tracking Report Screen
Number | Section | Name | Description |
1 | - | Simple/Custom Switch | Enables to toggle between two types of reports:
NOTE
|
2 | - | Paused/Active Switch | Enables to toggle the status of the report:
|
3 | - | Send Test Email | Enables to send a test email with the report to the recipients of the report or to the alternative recipients |
4 | Subject line | Enables to set the subject of the email that includes the report | |
Recipients | Enables to set the recipients of the email that will receive the report NOTE
| ||
5 | Select Data | Business Group | Enables to set a business group |
Process | Enables to a process NOTE The list of processes will be updated according to the selected business group | ||
Metadata | Enables to select metadata that will appear in the report | ||
Submitted Data | Enables to select submitted data that will appear in the report NOTE
| ||
6 | - | Include incomplete processes | Enables to include data from processes that are not completed yet |
7 | Date Range | Last | Enables to set the data range of the report according to the last number of days/months |
Accumulate Since | Enables to set the data range of the report according to data that was accumulated starting from a specific month and year | ||
Custom Range | Enables to set the data range of the report according to a custom range | ||
8 | Schedule | Frequency | Enables to set the frequency in which the report be sent automatically:
|
Time | Enables to set the time in which the report will be sent automatically - from 12 AM to 11 PM |
Simple Report Data
When creating a simple report, its data is taken from two resources:
- Metadata - fixed data that appears in every digital process. The Metadata is not affected by the selection of a business group and a process and contains the following information:
- Device
- Operating System (OS) Name
- OS Version
- Manufacturer
- Browser Name
- Browser Version
- Browser Language
- Type
- Transaction
- Source Value
- Source Type
- Request Identifier (RID)
- masterRid
- Device
- The masterRid is a unique identifier of an EasySend transaction. When creating a transaction, it can be divided into steps, for example, when using the Workflow Manager.
- The RID is a unique identifier of a transaction step. Each step receives its own RID as part of its URL, and it is nested under the masterRid, for example:

- Language
- Language Gender
- Is Co-Browsing On
- Agent Group
- Environment
- Time
- Type
- Status
- Customer Name
- Customer Phone Number
- Customer Email
- Sender Name
- Agent Trigger Type
- Is Test Transaction
- User:
- Role
- Geographical location (GEO)
- Submitted Data - data items that were created using the Model. The submitted data is affected by the selection of a business group and a process. The submitted data appears according to the data structure of the Model displaying data items in the order in which they were created. Object-type data items that contain other data items will display them when expended (see Figure 5):
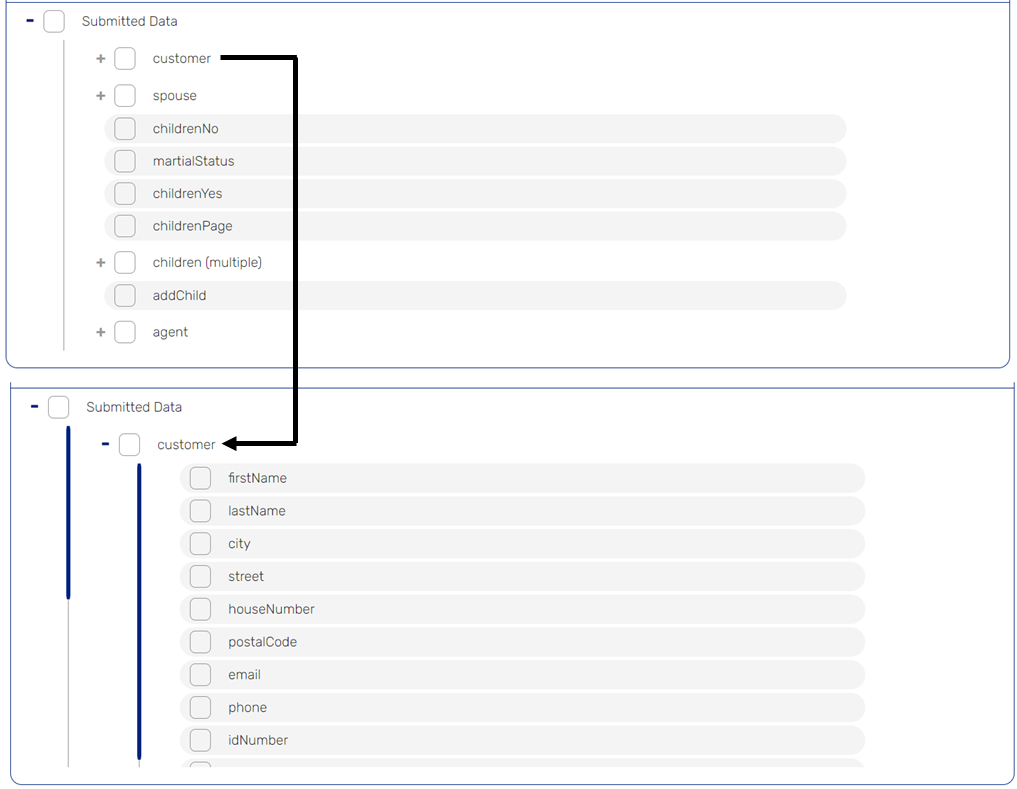
Figure 5: Submitted Data
Creating a Simple Report
(See Figure 6 and Figure 7)
To create a simple report, perform the following steps:
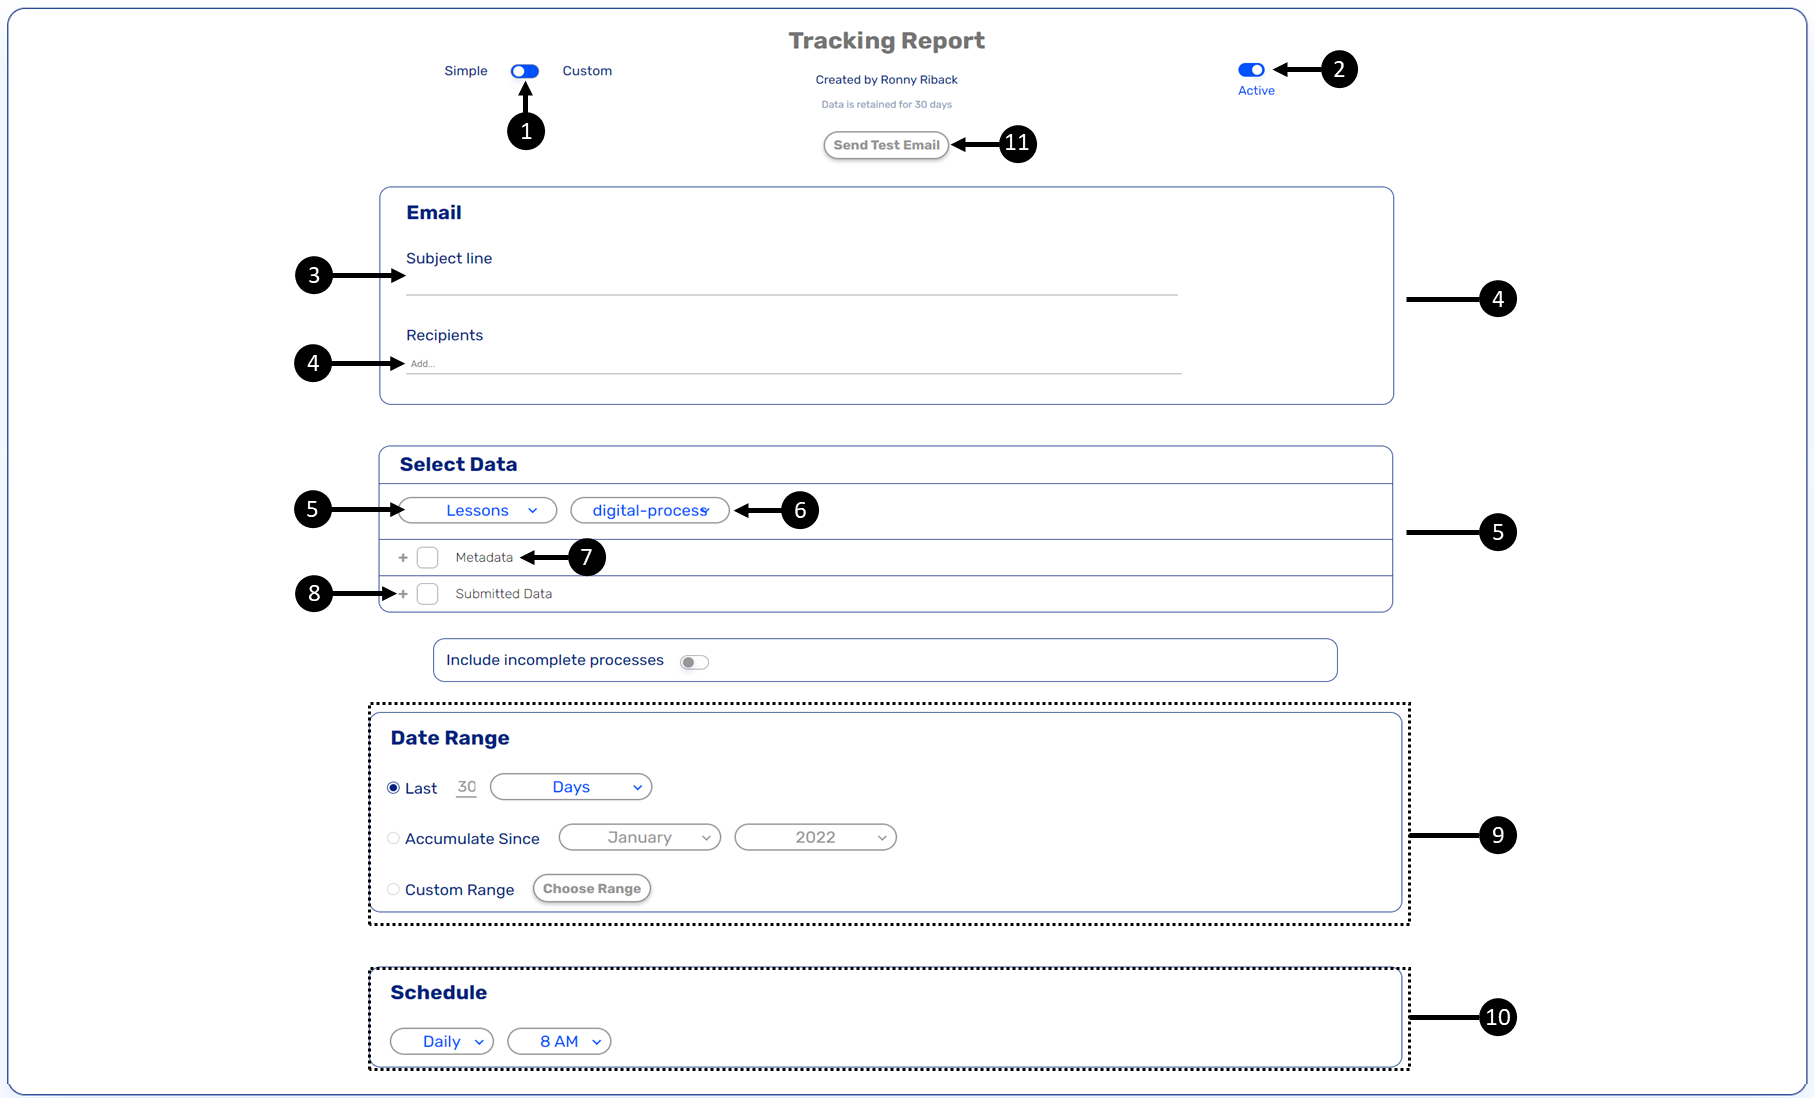
Figure 6: Creating a Simple Data Report
- Verify that the Simple/Custom switch (1) is set to Simple.
- Verify that the Active/Paused switch (2) is set to Active.
- Enter the subject of the email (3).
- Add the recipients (4).
- Select the business group (5) and the process (6).
- Select the desired metadata (7) and the desired submitted data (8).
- Set the data range (9).
- Set the schedule to determine when the report will be sent automatically (10).
- To evaluate the reception of the email with the report and view it, click the Send Test Email
button (11).
Result:
The Send Test Email window appears:

Figure 7: Send Test Email Window
- Report and emails of alternative recipients must be from an authorized domain.
- If a recipient email is not from an authorized domain, the following message will appear:
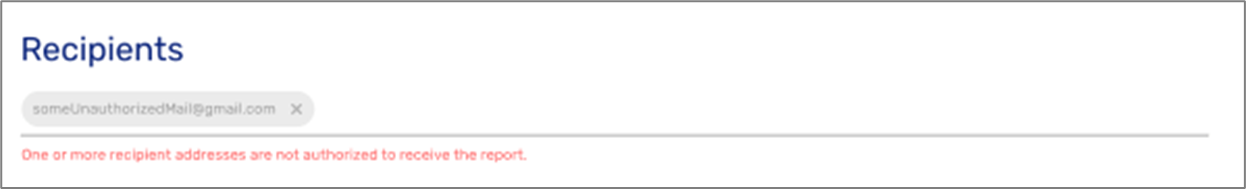
- To configure a list of authorized domains, please contact our support team.
- Select the desired recipients, either the same Report Receptions (12) you added in Step 4 or Alternative Report Receptions (13).
- Click the Ok button (14).
Simple Report Example
A simple report is sent as an Excel sheet via email to the added recipients. Figure 8 displays an example of an email and Figure 9 displays an example of a simple report.
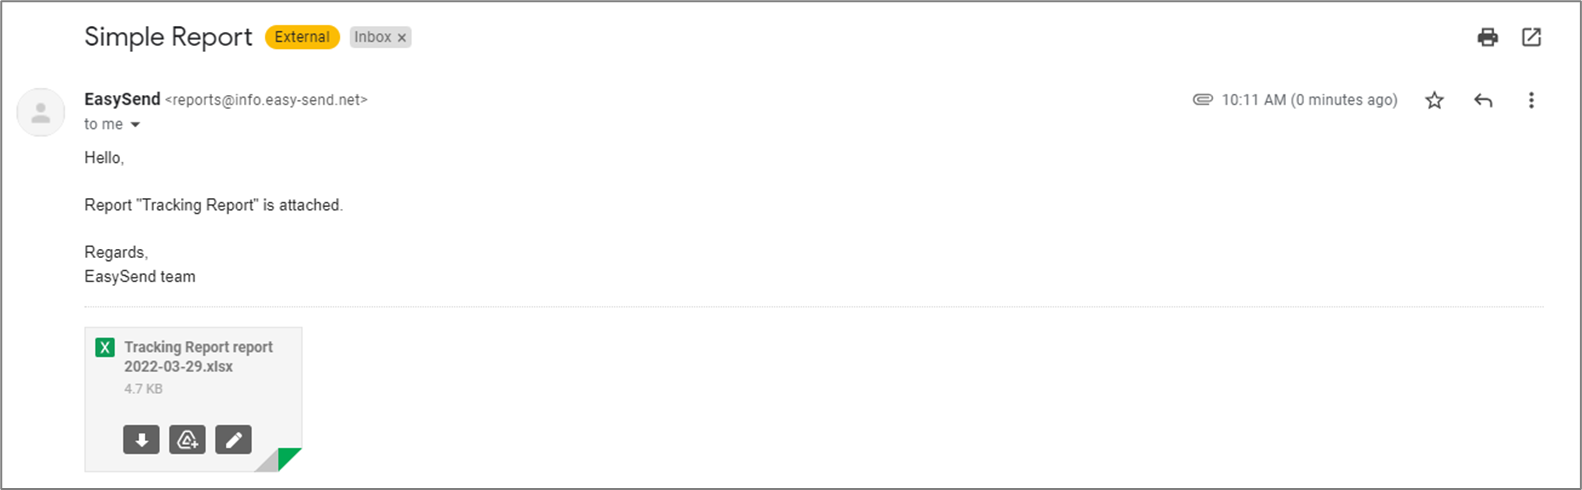
Figure 8: Email Example
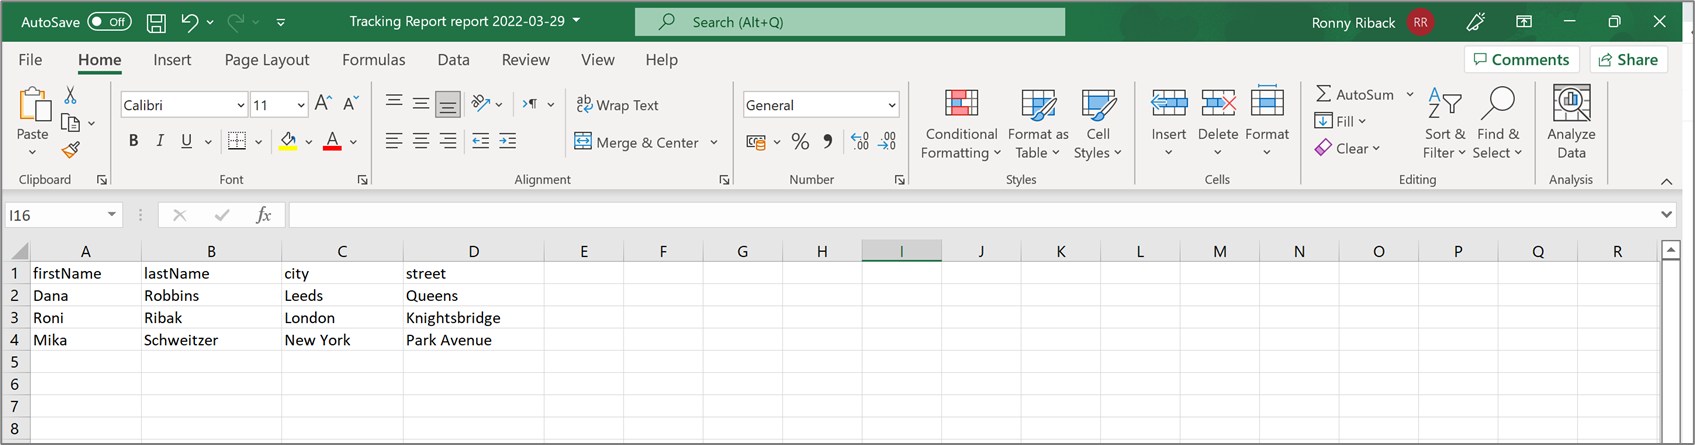
Figure 9: Report Example
Custom Report Data
When creating a custom report, you can edit the display name of the column headers that appear in the report, and in addition, you can select specific data items that will appear in the report from the Model.
How to Add Data to a Custom Report?
(See Figure 10 to Figure 12)
You can add data to a custom report using two different ways:
- By selecting submitted data and/or metadata fields when the report is set to simple
- By selecting specific data items from the Model while the report is set to custom.
To add data to a custom report, perform the following steps:
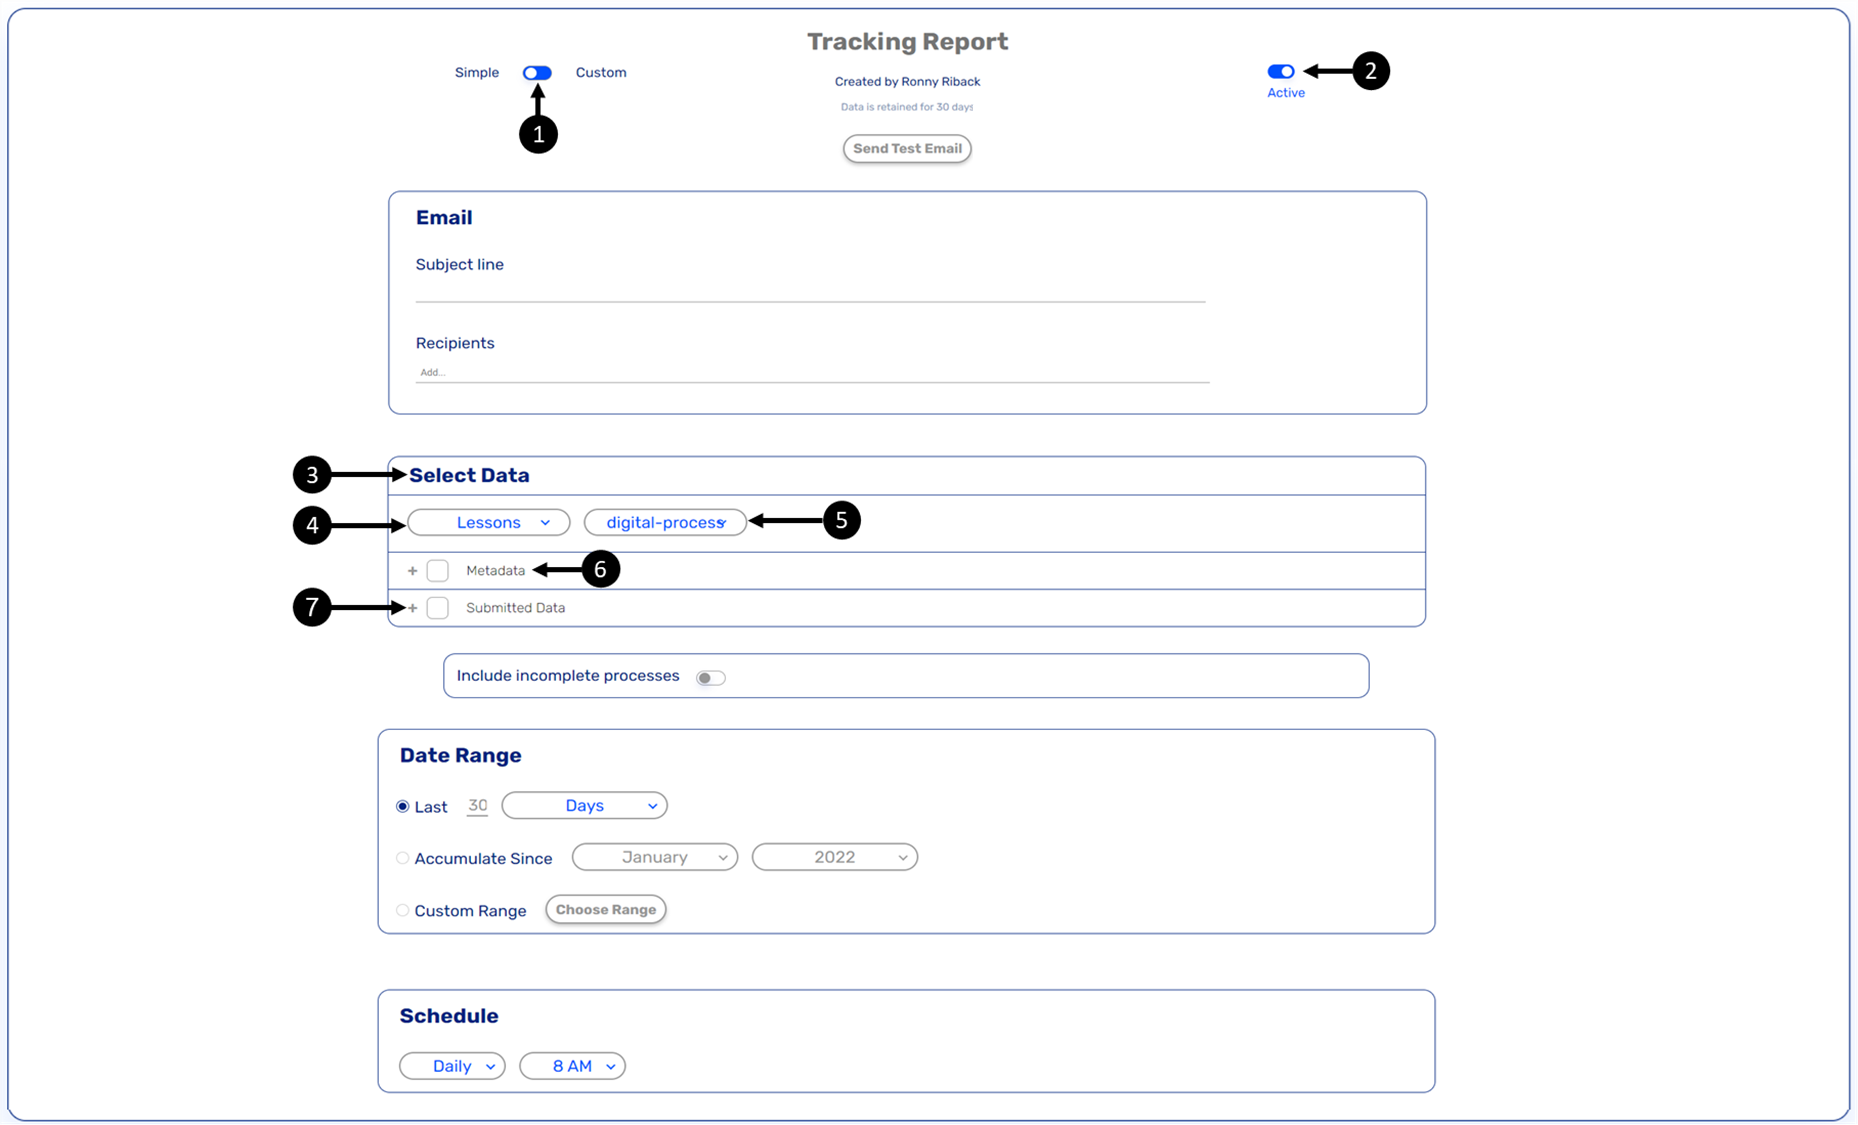
Figure 10: Simple Report - Data Selection
- Verify that the Simple/Custom switch (1) is set to Simple.
- Verify that the Active/Paused switch (2) is set to Active.
- In the Select Data section (3):
- Select the destined business group (4) and process (5).
- Select the desired Submitted Data (6) and/or Metadata (7) fields.
- Toggle the Simple/Custom switch (8) to Custom.
- Locate the Report Columns (9) section.
- Click the Add new row + button (10).
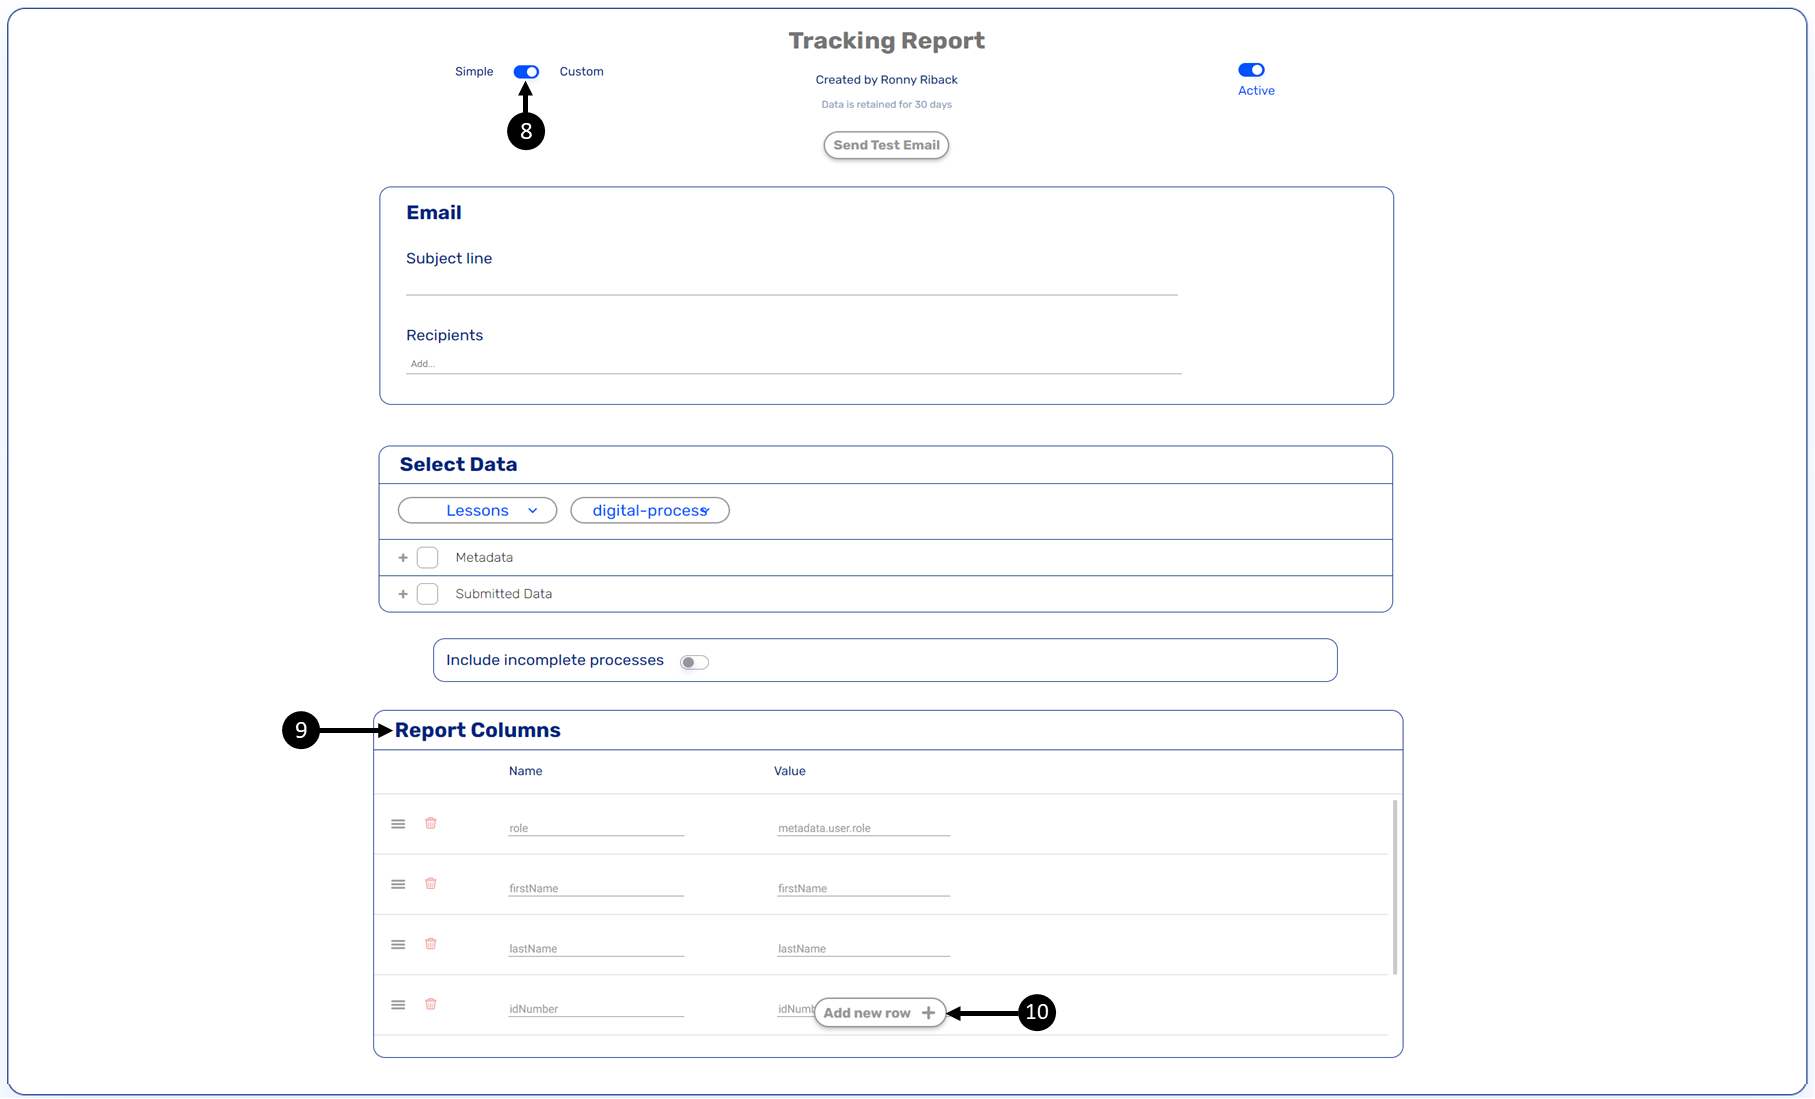
Figure 11: Custom Report - Adding a New Row
Result:
A new row is added (11):
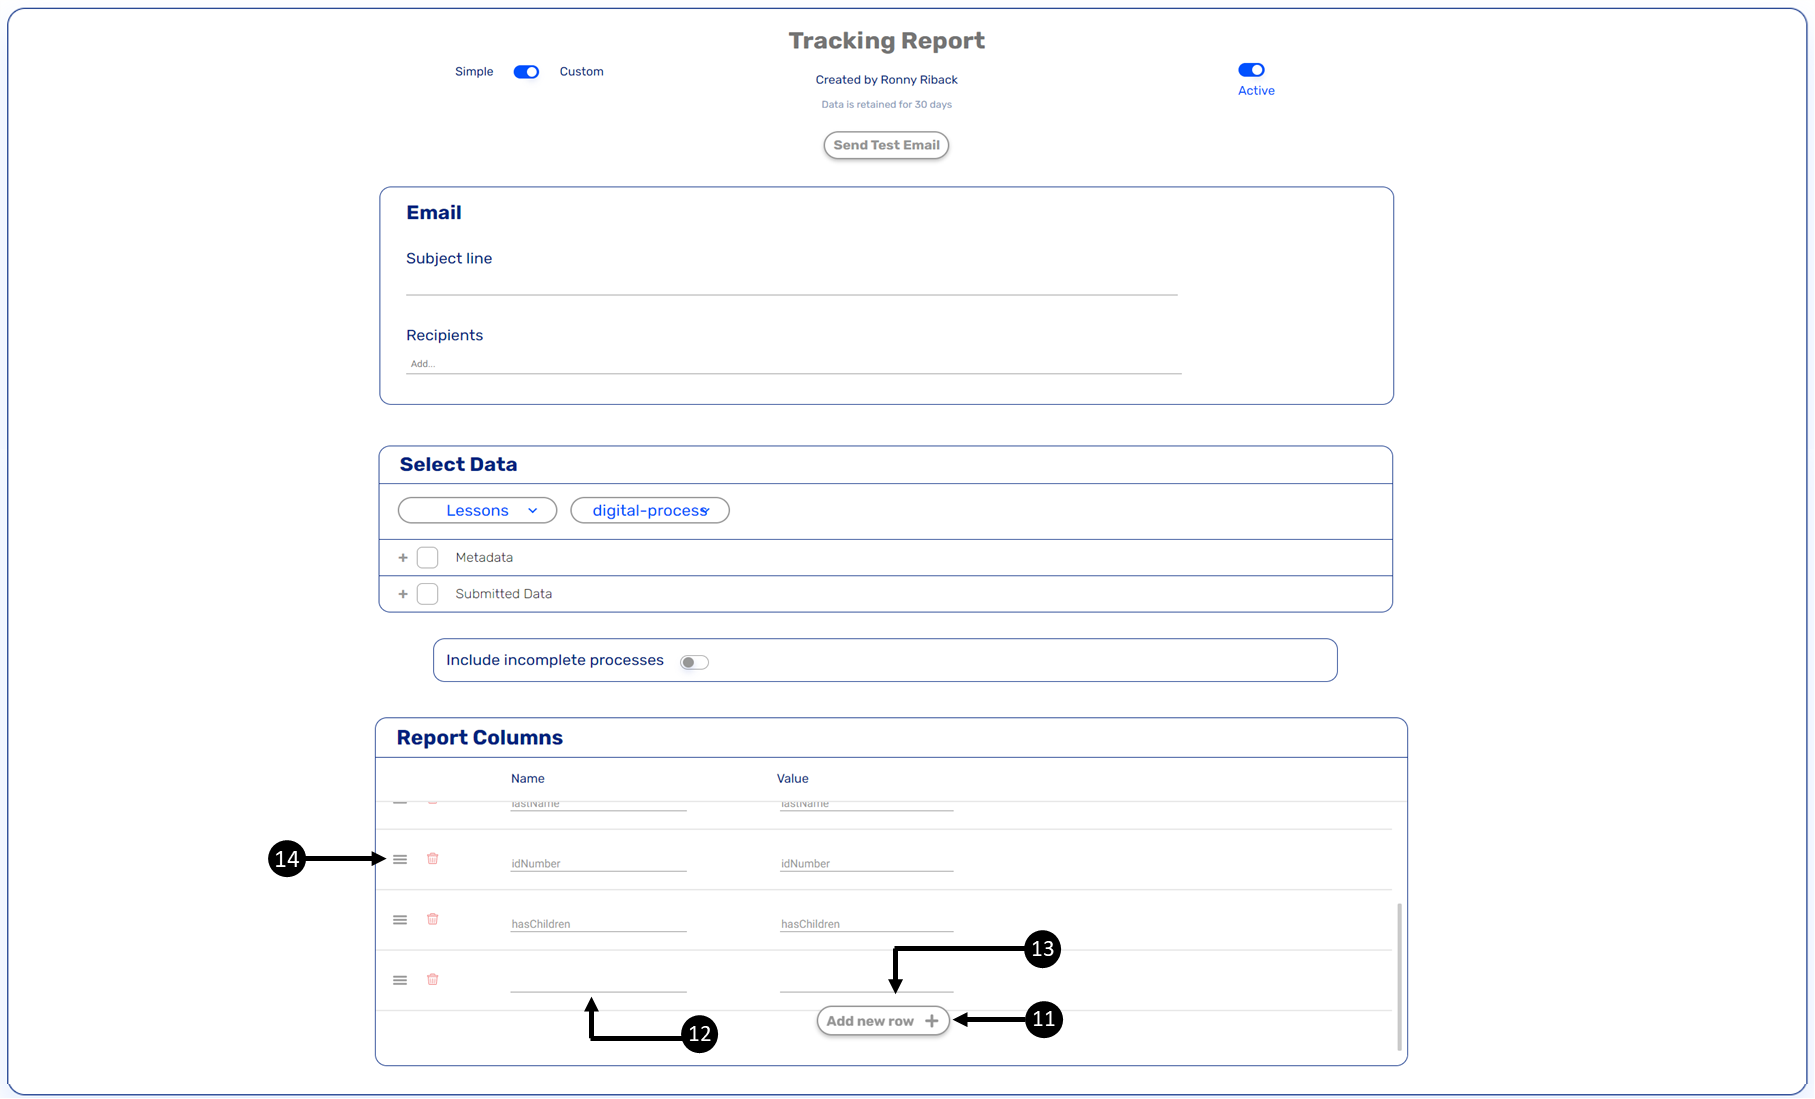
Figure 12: Custom Report - Adding New Data
- Enter a Name (12).
- Enter a Value (13).
When adding a value, you can use dots (.) to locate and add data items from the Model.
- Repeat steps 5 to 7 to add additional data items.
- If necessary, edit the names.
- If necessary, rearrange the data by using the drag-and-drop option (14).
Custom Report Example
A custom report is sent as an Excel sheet via email to the added recipients. Figure 13 displays an example of a custom report.
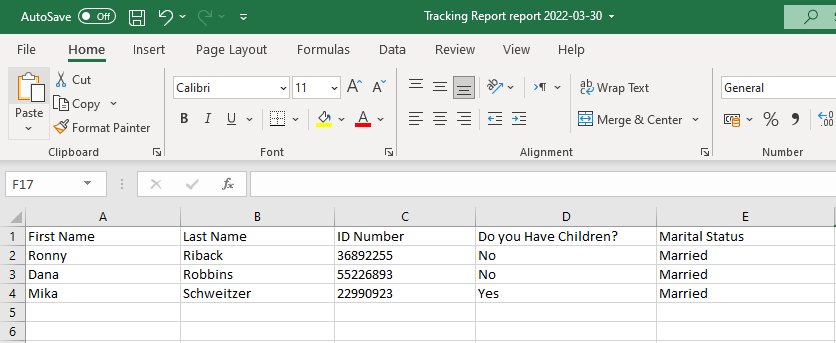
Figure 13: Custom Report Example
Search Reports Screen
Clicking the Search Report option displays the search Reports screen. Figure 14 and Table 2 describe the Search Reports screen structure.
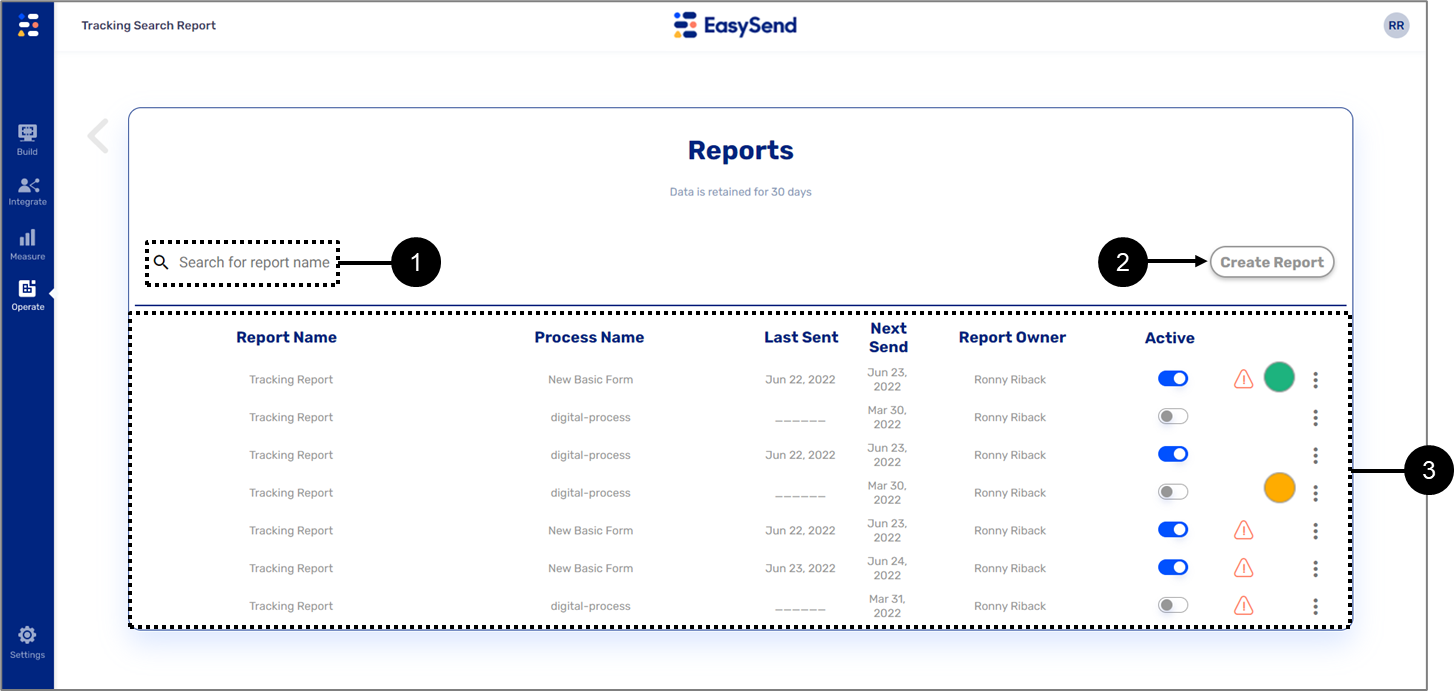
Figure 14: Search Reports Screen
Table 2: Search Reports Screen
Number | Section | Icon | Name | Description |
1 | - | - | Search for report name | Enables to search reports by name from the Reports list |
2 | - | - | Create Report | Enables to create a new report by navigating to the Tracking Reports screen |
3 | Reports List | - | Report Name | Displays the name of the report |
- | Process Name | Displays the name of the process | ||
- | Last Sent | Displays the date on which the report was last sent | ||
- | Next Send | Displays the date on which the report will be sent again | ||
- | Report Owner | Displays the name of the owner of the report | ||
- | Active | Displays the status of the report:
| ||
 | Status | Displays the status of the report sending:
| ||
 | Additional Actions | Enables to perform additional actions:
|


Error Notifications
(See Figure 15)
An error notification will appear adjacent to a field used in a report in cases where the field does not exist in the processes model, for example:
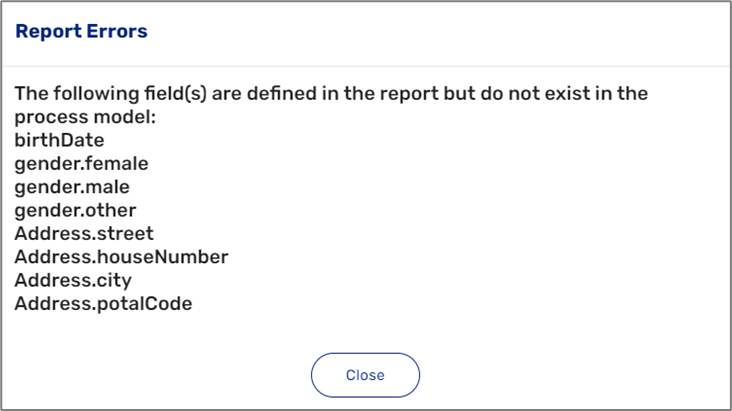
Figure 15: Report Errors
An error notification will also appear if an unauthorized email is added to the recipients.
Report Sending Limitations
Report sending has several limitations:
- Model structure - the Model structure changes constantly when updates are made to the Model/Webflow, but in the environment server, the model is stored as is when transactions occur. The report needs the accurate Model structure at a specific time to load Model-transaction data into an Excel row. Up to four fallback process attempts are made to load the data before omitting some columns from the report.
- Maximum number of rows in a custom report - up to 30,000 rows in a report whose columns were manually declared.
- Maximum number of rows in a simple report - up to 10,000 rows when all columns are selected.
Overview Reports
The following sections describe the Overview reports screen and its features.
How to Navigate to the Overview Reports Screen
(See Figure 16 to Figure 18)
To navigate to the Overview Reports screen, perform the following steps:
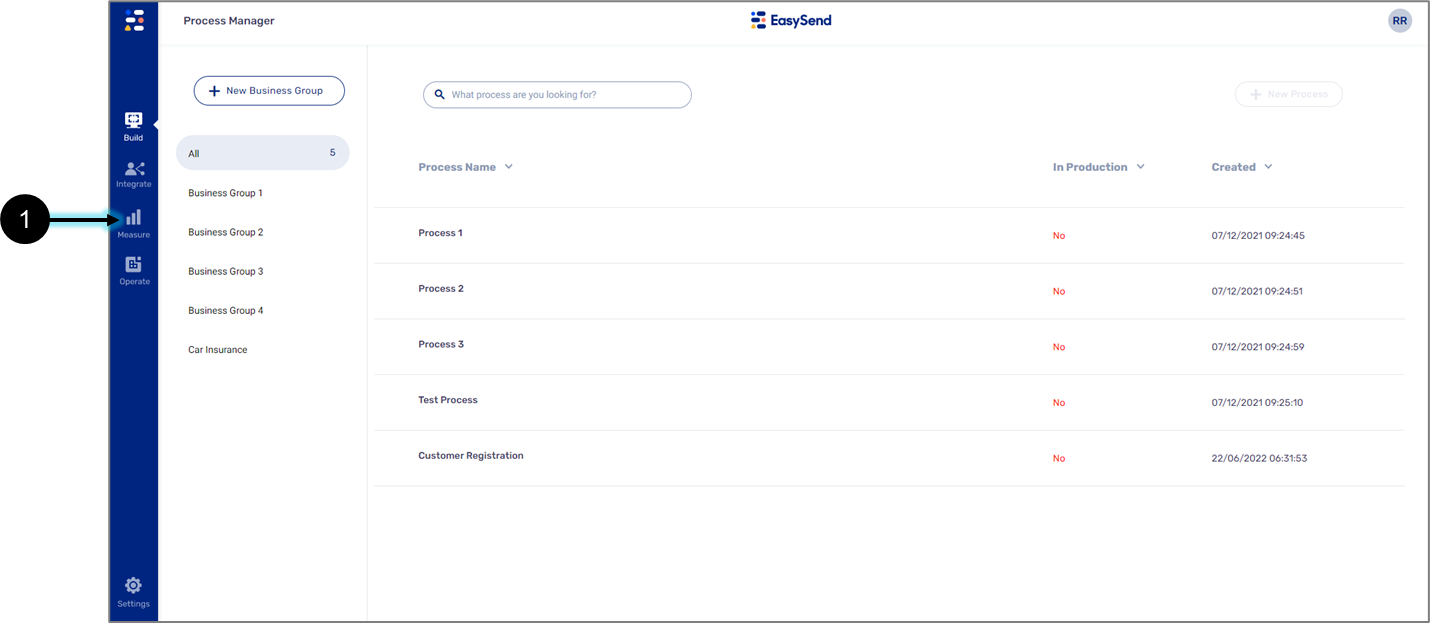
Figure 16: Measure Tab
- Click the Measure tab (1).
Result:
The Measure tab options appear:
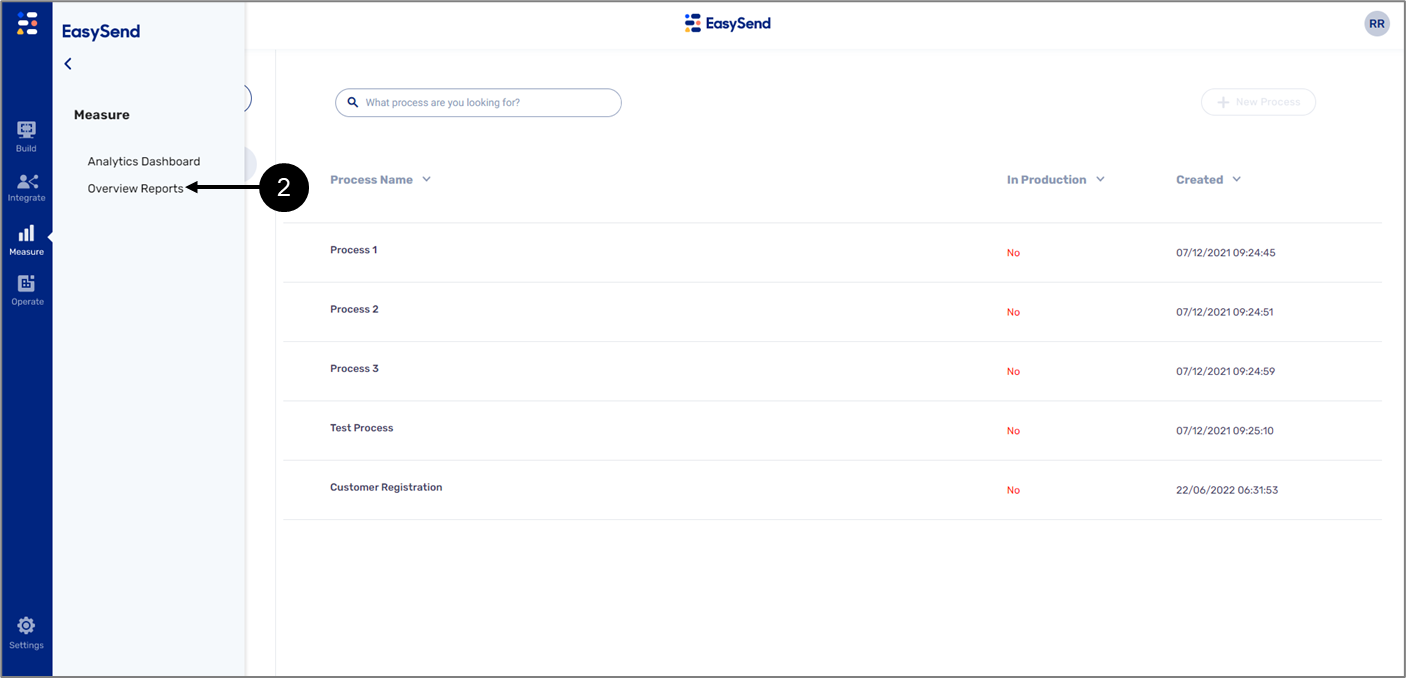
Figure 17: Overview Reports Option
- Click the Overview Report option (2).
Result:
The Overview Reports screen appears:
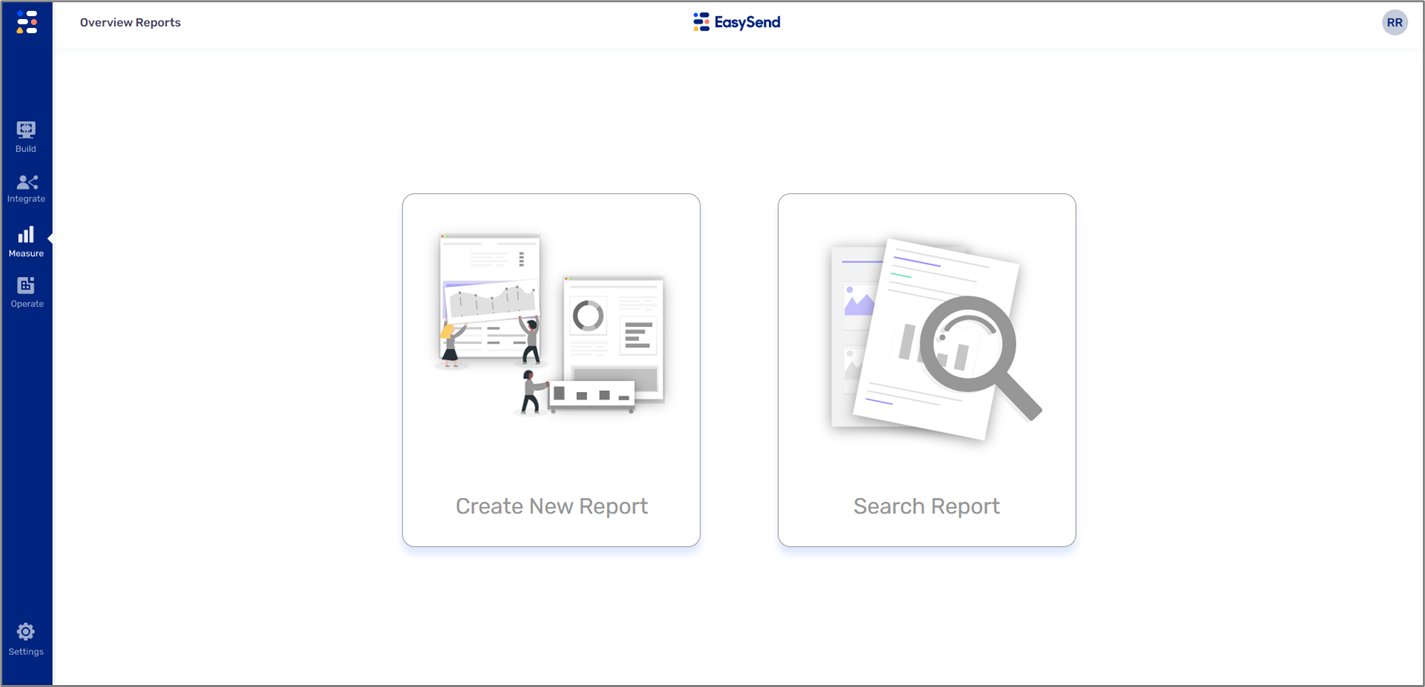
Figure 18: Overview Reports Screen
Overview Reports Screen
(See Figure 18)
The Overview Reports screen contains two options:
- Create a New Report
- Search Reports
Create New Report - Analytics Edit Report Screen
Clicking the Create New Report option displays the Analytics Edit Report screen.
Analytics reports are statistical reports that provide an overview of digital processes and contain data about how many sessions were:
- Created
- Opened
- Completed
Figure 19 and Table 4 describe the Analytics Report screen structure.
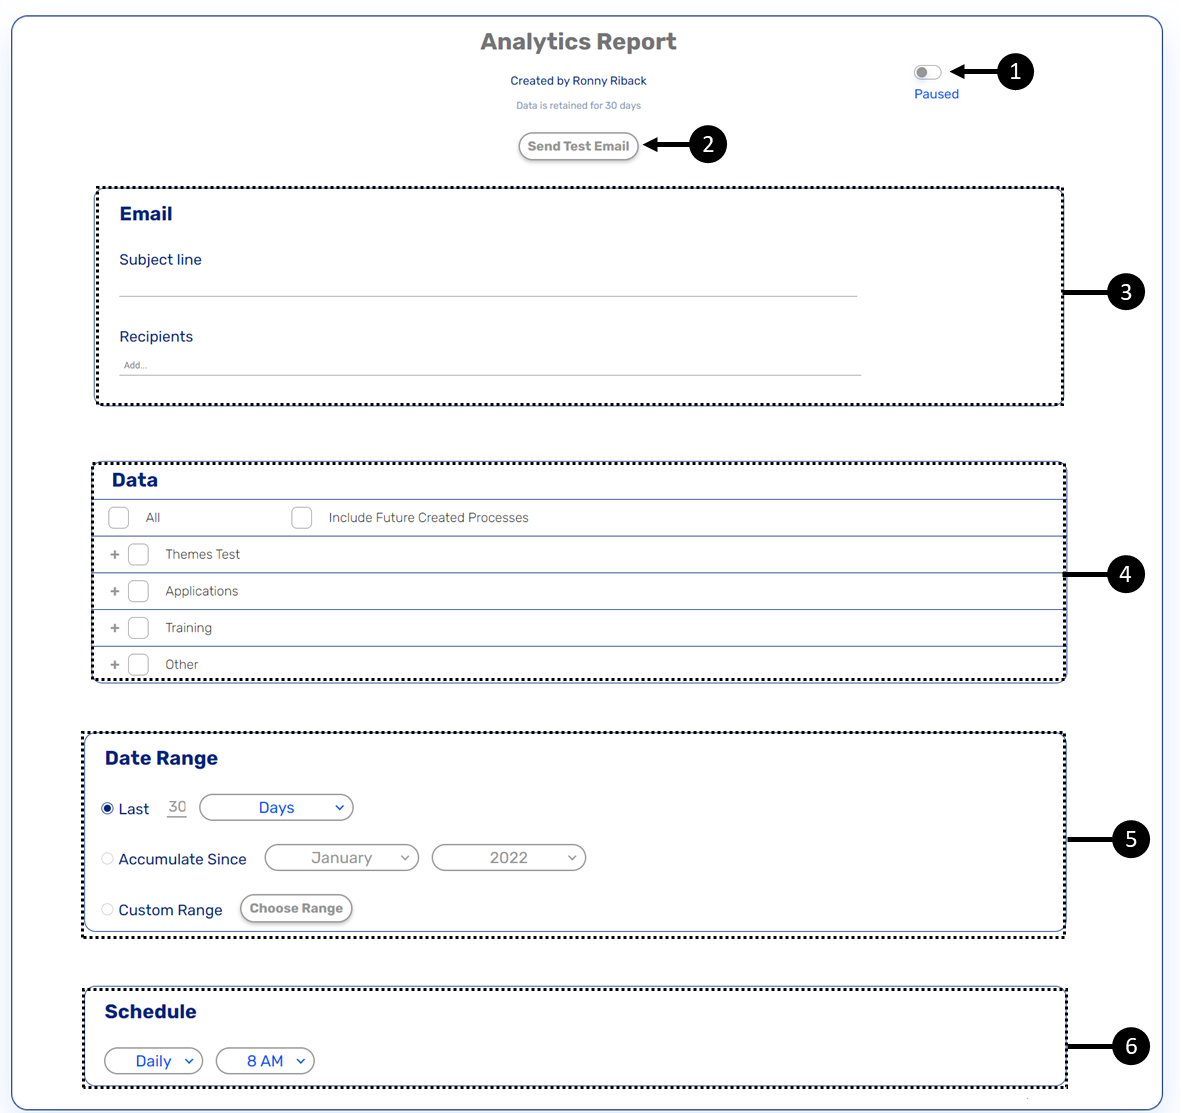
Figure 19: Analytics Reports Screen
Table 4: Analytics Report Screen
Number | Section | Name | Description |
1 | - | Paused/Active Switch | Enables to toggle the status of the report:
|
2 | - | Send Test Email | Enables to send a test email with the report to the recipients of the report or to the alternative recipients |
3 | Subject line | Enables to set the subject of the email that includes the report | |
Recipients | Enables to set the recipients of the email that will receive the report NOTE
| ||
4 | Data | Business Group and Processes | Enables to select multiple business groups and processes for the analytics report |
5 | Date Range | Last | Enables to set the data range of the |
Accumulate Since | Enables to set the data range of the report according to data that was accumulated starting from a specific month and year | ||
Custom Range | Enables to set the data range of the report according to a custom range | ||
6 | Schedule | Frequency | Enables to set the frequency in which the report be sent:
|
Time | Enables to set the time in which the report will be automatically sent - from 12 AM to 11 PM |
Analytics Logic
(See Figure 20)
The Analytics Dashboard displays the number of sessions in different stages and not the number of events that happened during a session. Displaying the number of sessions and not the number of events makes the dashboard more intuitive for users to understand:
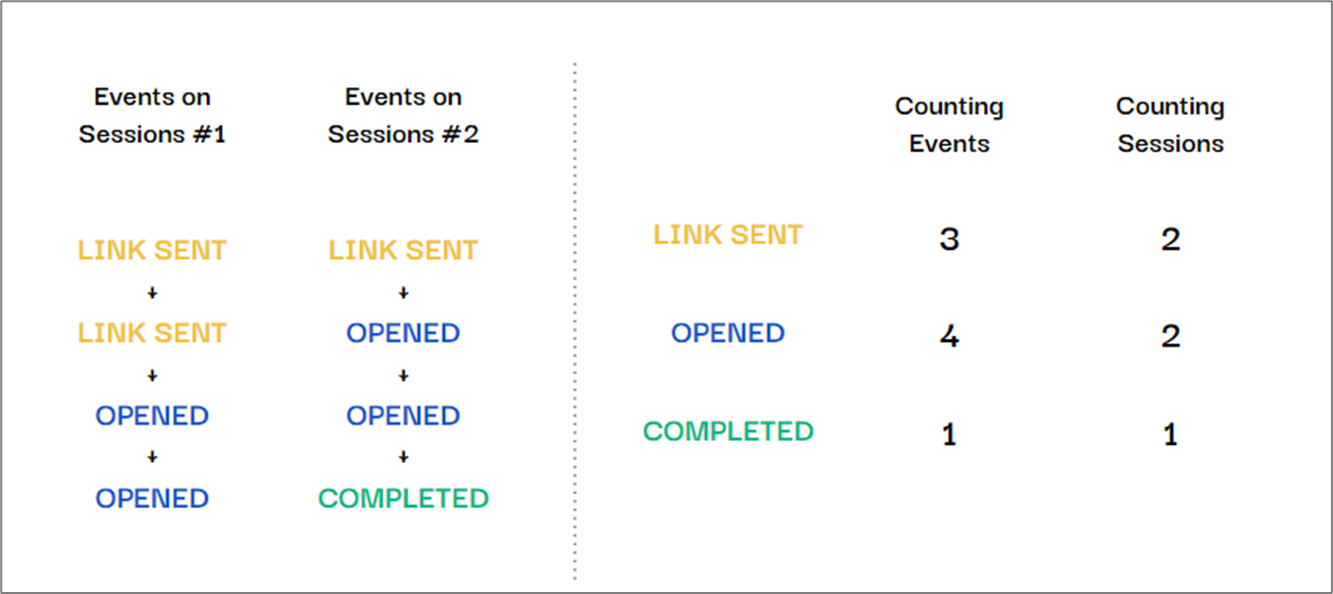
Figure 20: Sessions and Events
Creating an Analytic Report
(See Figure 21 and Figure 22)
To create a simple report, perform the following steps:
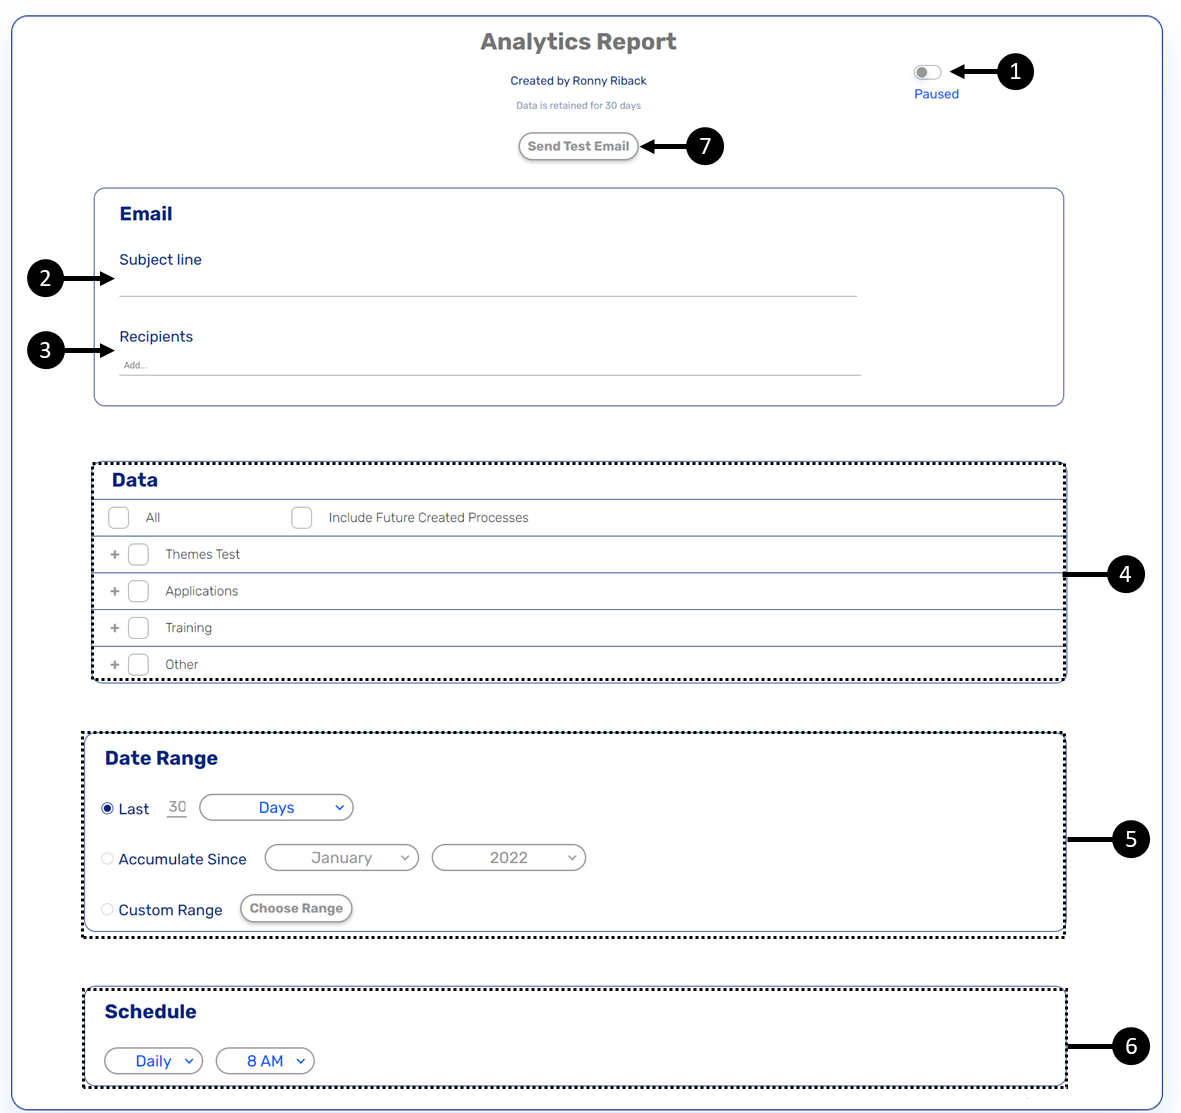
Figure 21: Creating a Simple Data Report
- Verify that the Active/Paused switch (1) is set to Active.
- Enter the subject of the email (2).
- Add the recipients (3).
- Select the Data (4), business group, and processes.
- Set the data range (5).
- Set the schedule to determine when the report will be sent automatically (6).
- To evaluate the reception of the email with the report and view it, click the Send Test Email
button (7).
Result:
The Send Test Email window appears:
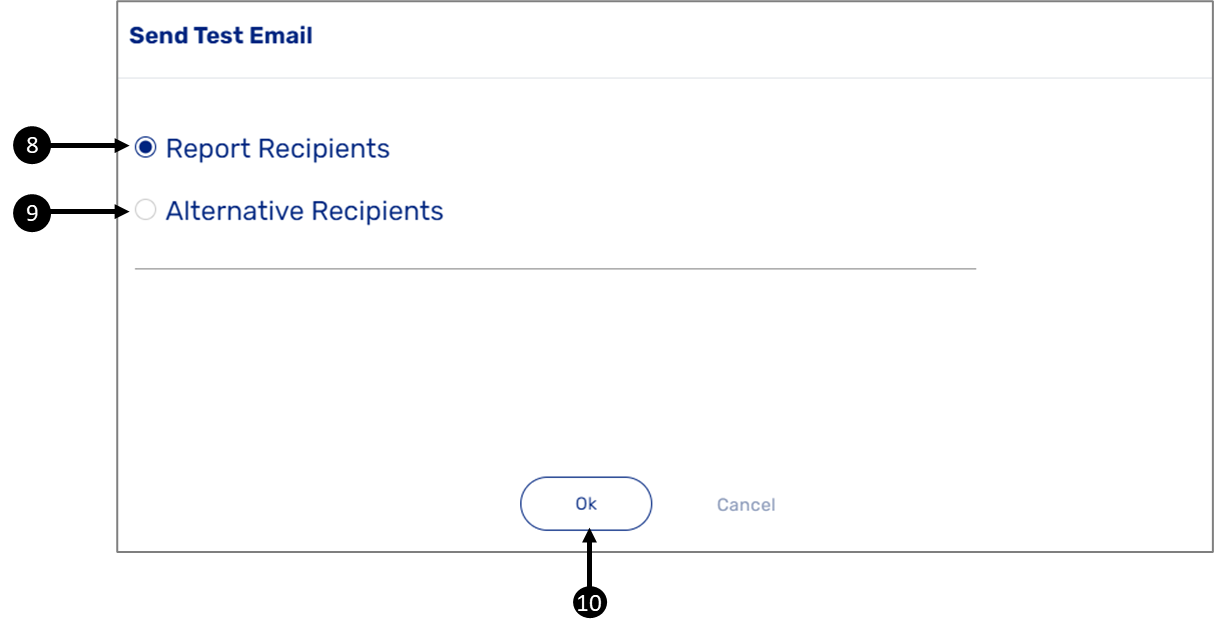
Figure 22: Send Test Email Window
- Report and emails of alternative recipients must be from an authorized domain.
- If a recipient email is not from an authorized domain, the following message will appear:
- To configure a list of authorized domains, please contact our support team.
- Select the desired recipients, either the same Report Receptions (8) you added in step 3 or Alternative Report Receptions (9).
- Click the Ok button (10).
Analytics Report Example
A simple report is sent as an Excel sheet via email to the added recipients. Figure 23 displays an example of an email and Figure 24 displays an example of a simple report.
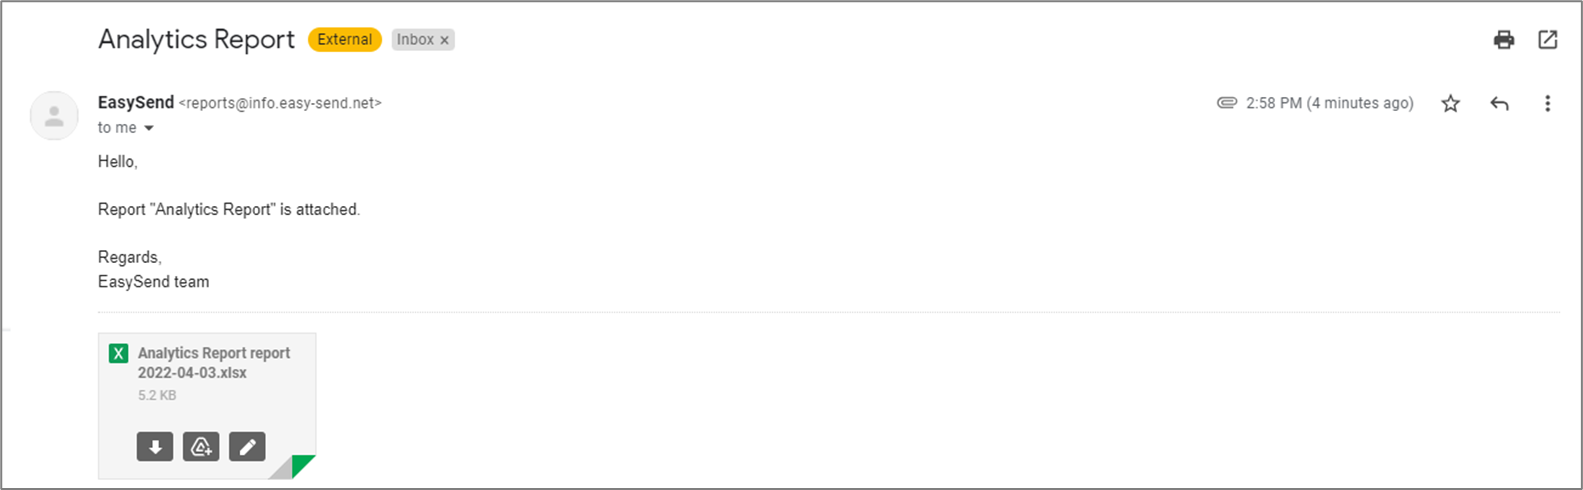
Figure 23: Email Example
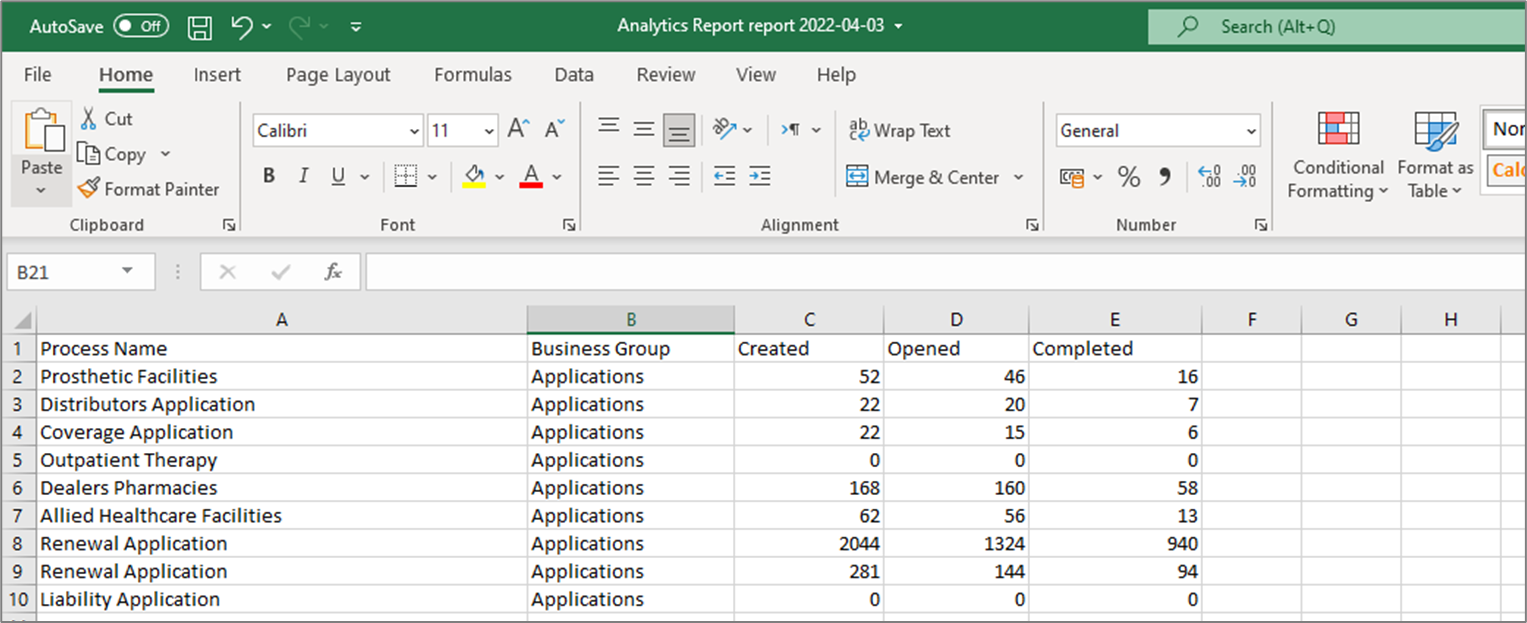
Figure 24: Report Example
Search Reports Screen
Clicking the Search Report option displays the Search Reports screen. Figure 25 and Table 5 describe the Search Reports screen structure.
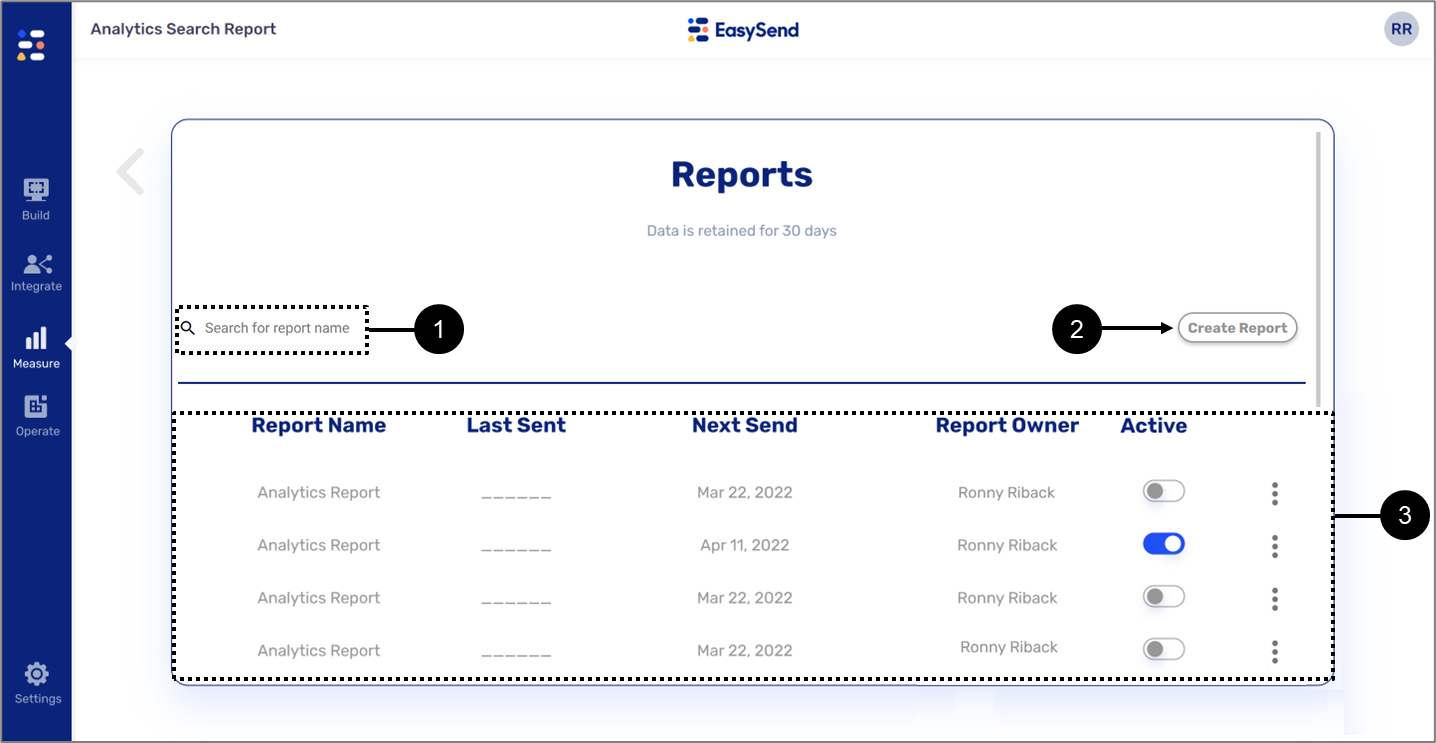
Figure 25: Search Reports Screen
Table 5: Search Reports Screen
Number | Section | Icon | Name | Description |
1 | - | - | Search for the report name | Enables to search reports by name from the Reports list |
2 | - | - | Create Report | Enables to create a new report by navigating to the Tracking Reports screen |
3 | Reports List | - | Report Name | Displays the name of the report |
- | Last Sent | Displays the date on which the report was last sent | ||
- | Next Send | Displays the date on which the report will be sent again | ||
- | Report Owner | Displays the name of the owner of the report | ||
- | Active | Displays the status of the report:
| ||
 | Additional Actions | Enables to perform additional actions:
|


Troubleshooting
Table 6 describes malfunctions that may occur when trying to create transaction data items, associate transaction data items with Webflow components, and enforce logic. The table also describes the reason/s for the malfunctions and provides possible solutions.
Table 6: Troubleshooting
Number | Malfunction | Reason/s | Solution/s |
1 | Reports not sent | The report is set to Paused | Set the report to Active as described in the Creating a Simple Report section or the Creating an Analytic Report section |
2 | The desired submitted data for the report is missing | The desired business group or process are not selected | Select the desired business group and process as described in the Creating a Simple Report section |
3 | Metadata does not appear in the custom report | Metadata was not selected before the report was set to custom | Set the report to Simple and select the desired metadata, then, set the report to Custom as described in the How to Add Data to a Custom Report? section |