Article Overview
The following article describes what an analysis is, how to create it, and the structure of the analysis screen. The article also details what sheets are and the settings options.
What is an Analysis
(See Figure 1)
An analysis is the prime workspace for creating data visualizations, which are graphical representations of your data. Each analysis contains a collection of visualizations that you arrange and customize.
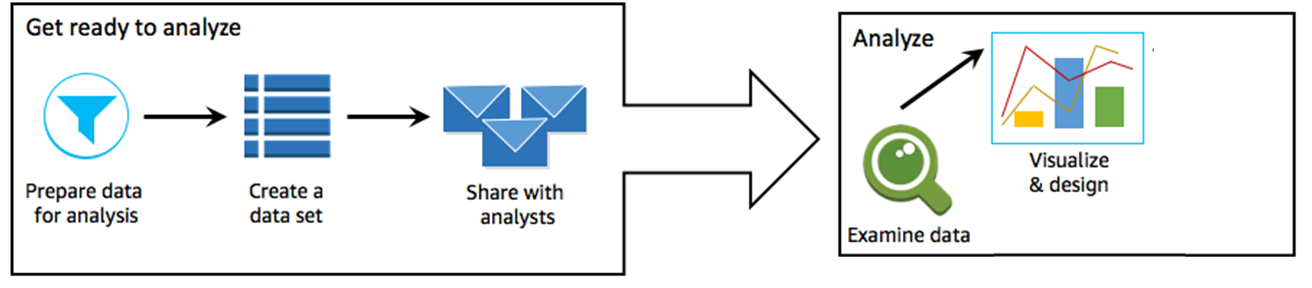
Figure 1: What is an Analysis?
Data visualization, also known as visual, is a graphical representation of data. There are many types of visualizations, including diagrams, charts, graphs, and tables.
Creating an Analysis
(See Figure 2 to Figure 7)
To create an analysis, perform the following steps:
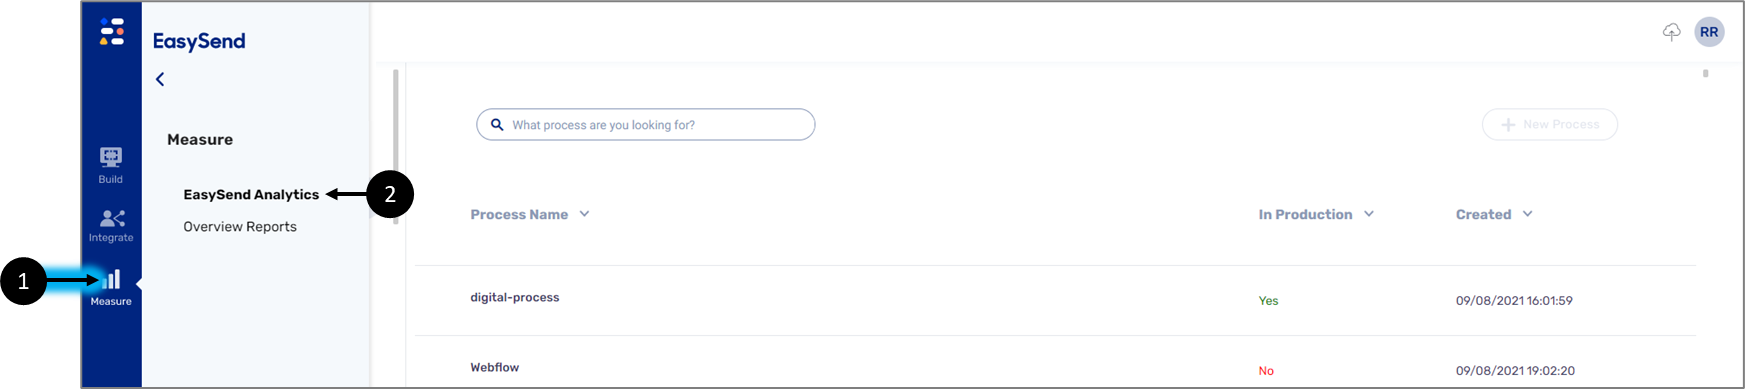
Figure 2: Navigating to EasySend Analytics
- Click Measure (1).
- Click EasySend Analytics (2).
Result:
The EasySend Analytics main screen appears:
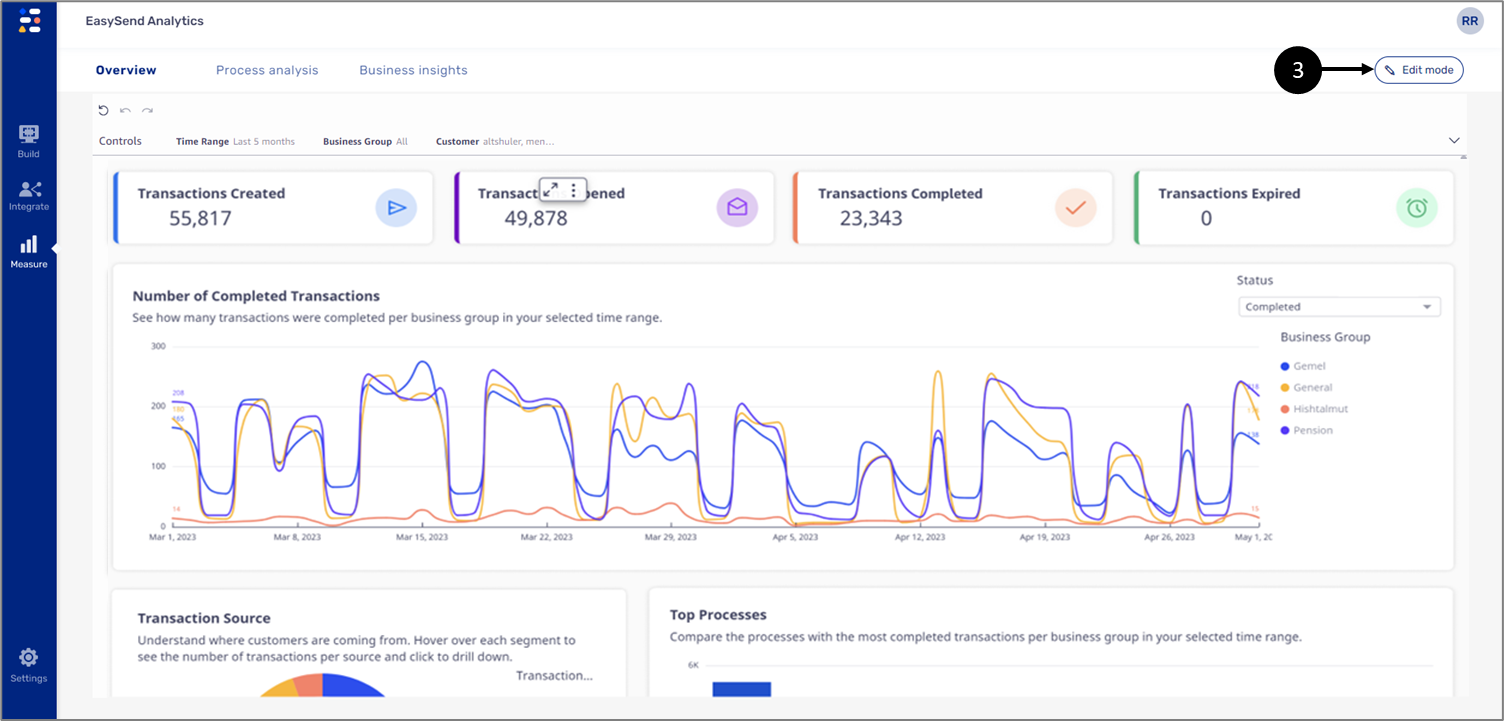
Figure 3: Edit mode Button
- Click the Edit mode button (3).
Result:
The authoring screen appears:
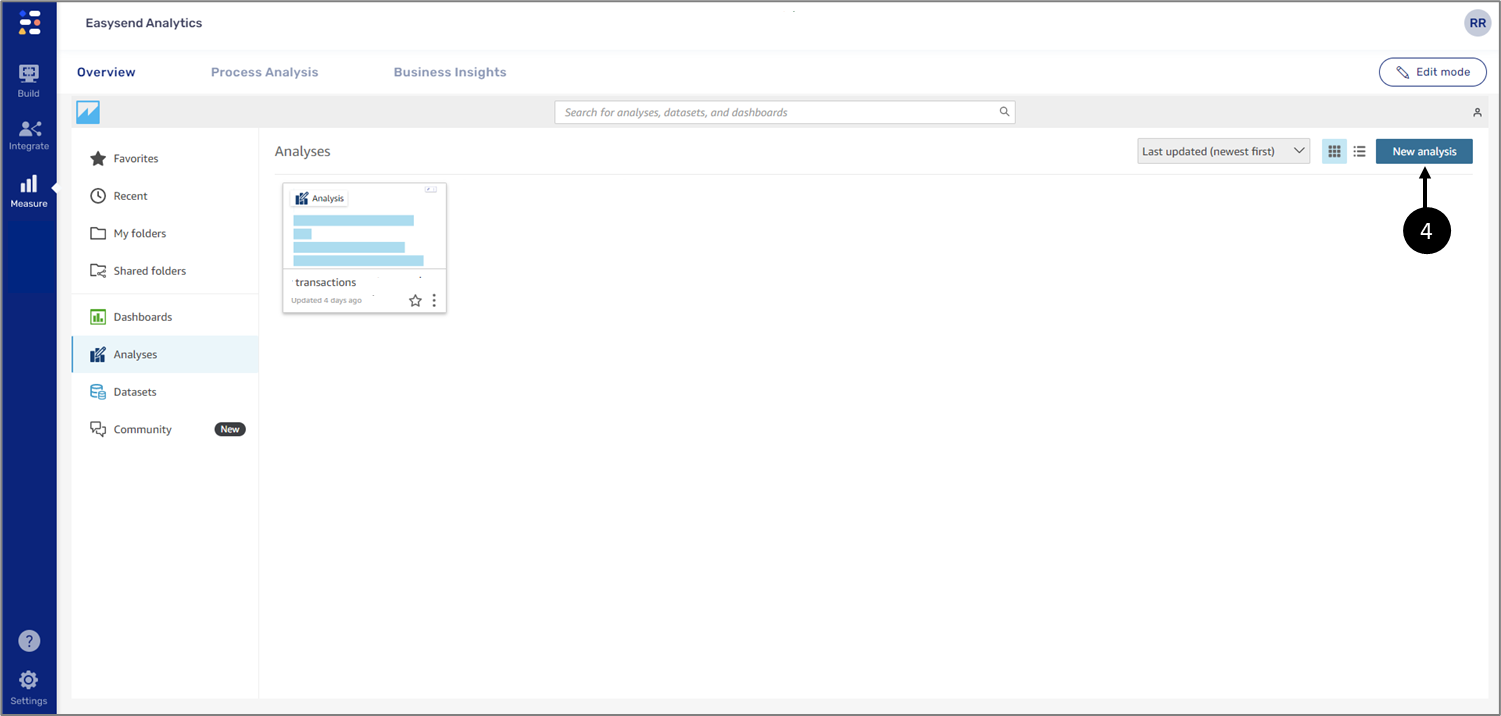
Figure 4: New analysis Button
- Click the New analysis button (4).
Result:
A screen containing your datasets appears:
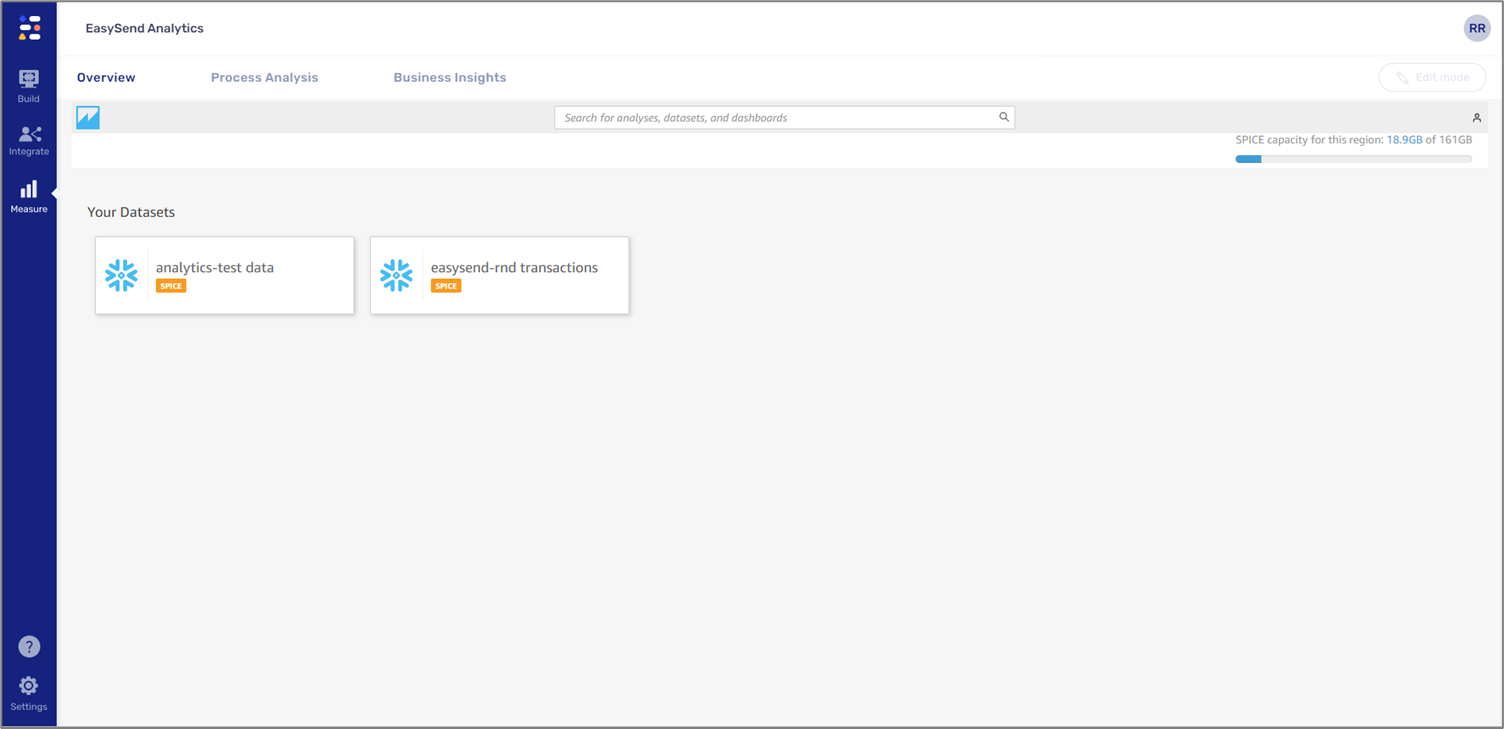
Figure 5: Datasets
- Click the desired dataset.
Result:
A screen with dataset information appears:
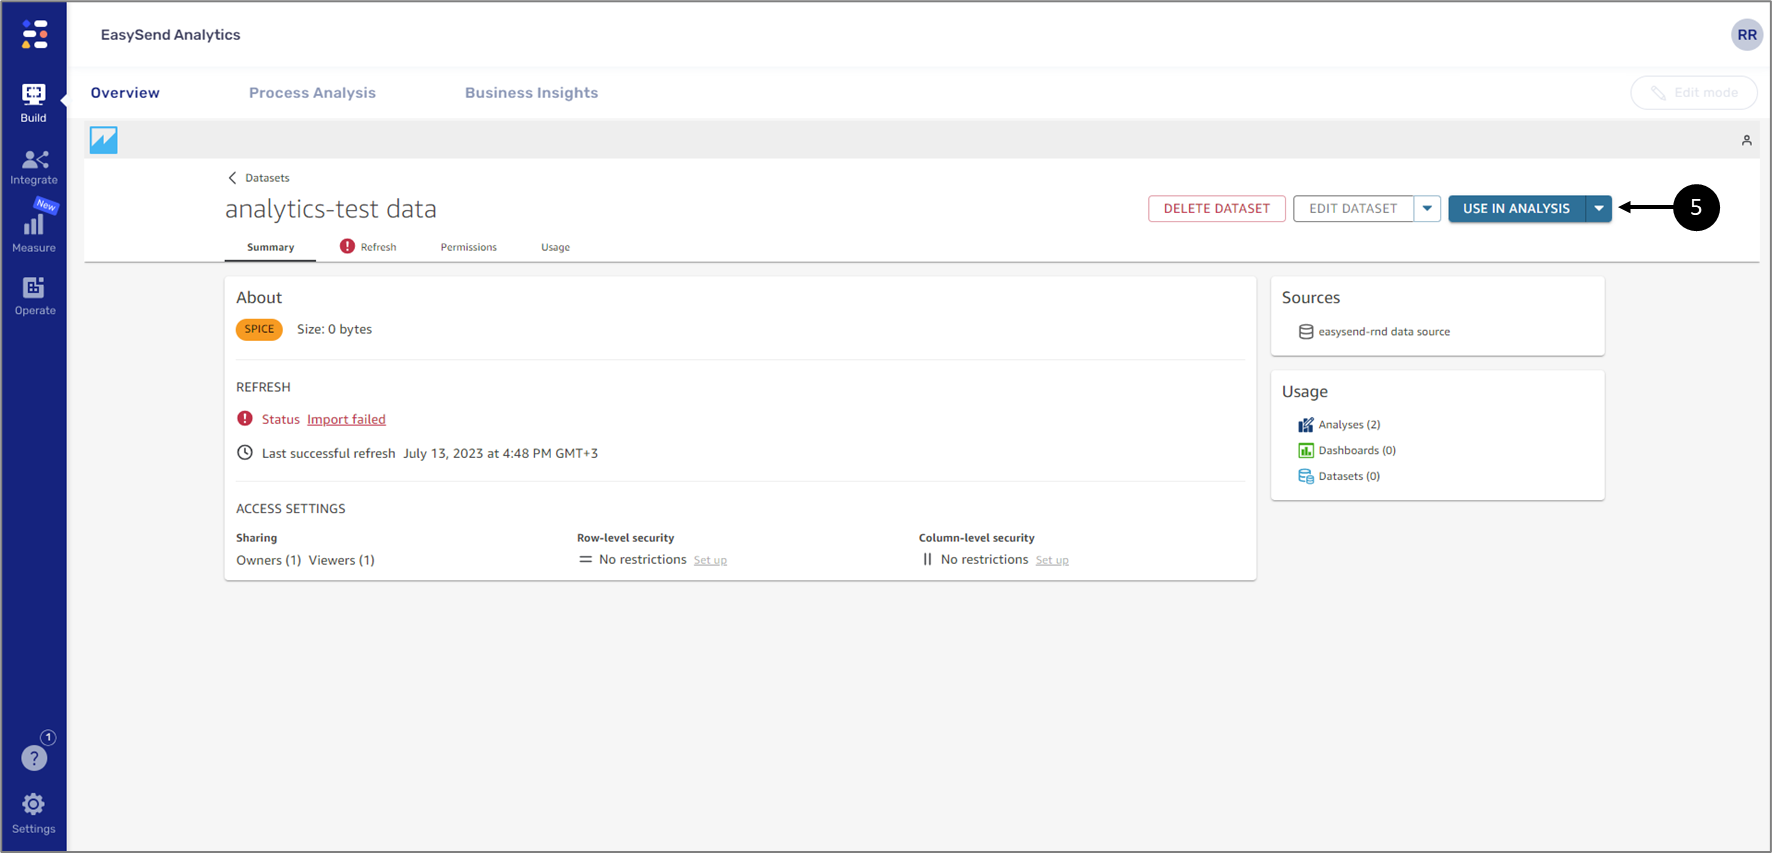
Figure 6: USE IN ANALYSIS Button
- Click the USE IN ANALYSIS button (5).
Result:
The analysis screen appears.
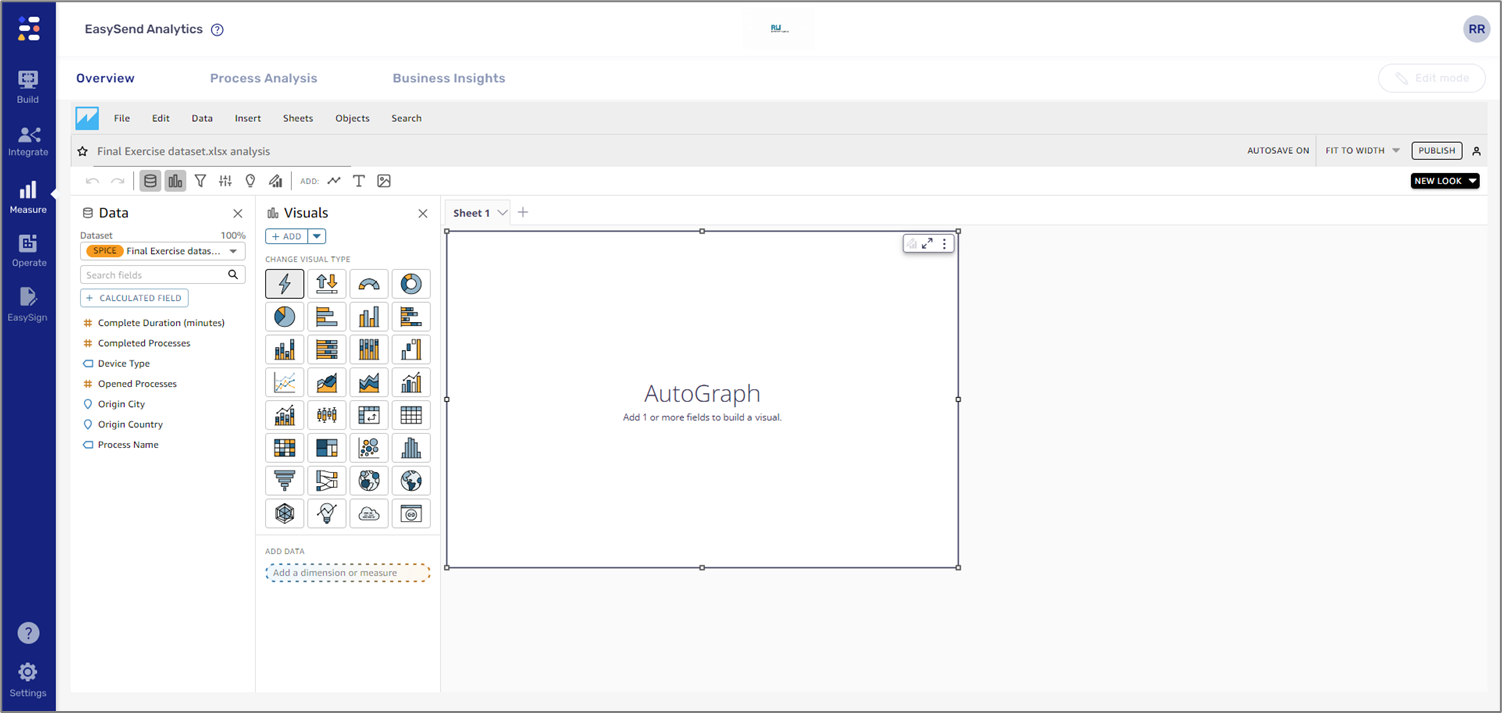
Figure 7: Analysis Screen
- Clicking the desired dataset.
- Clicking the three dots and then Create analysis.
Analysis Screen Description
Figure 8 and Table 1 describe the analysis screen.
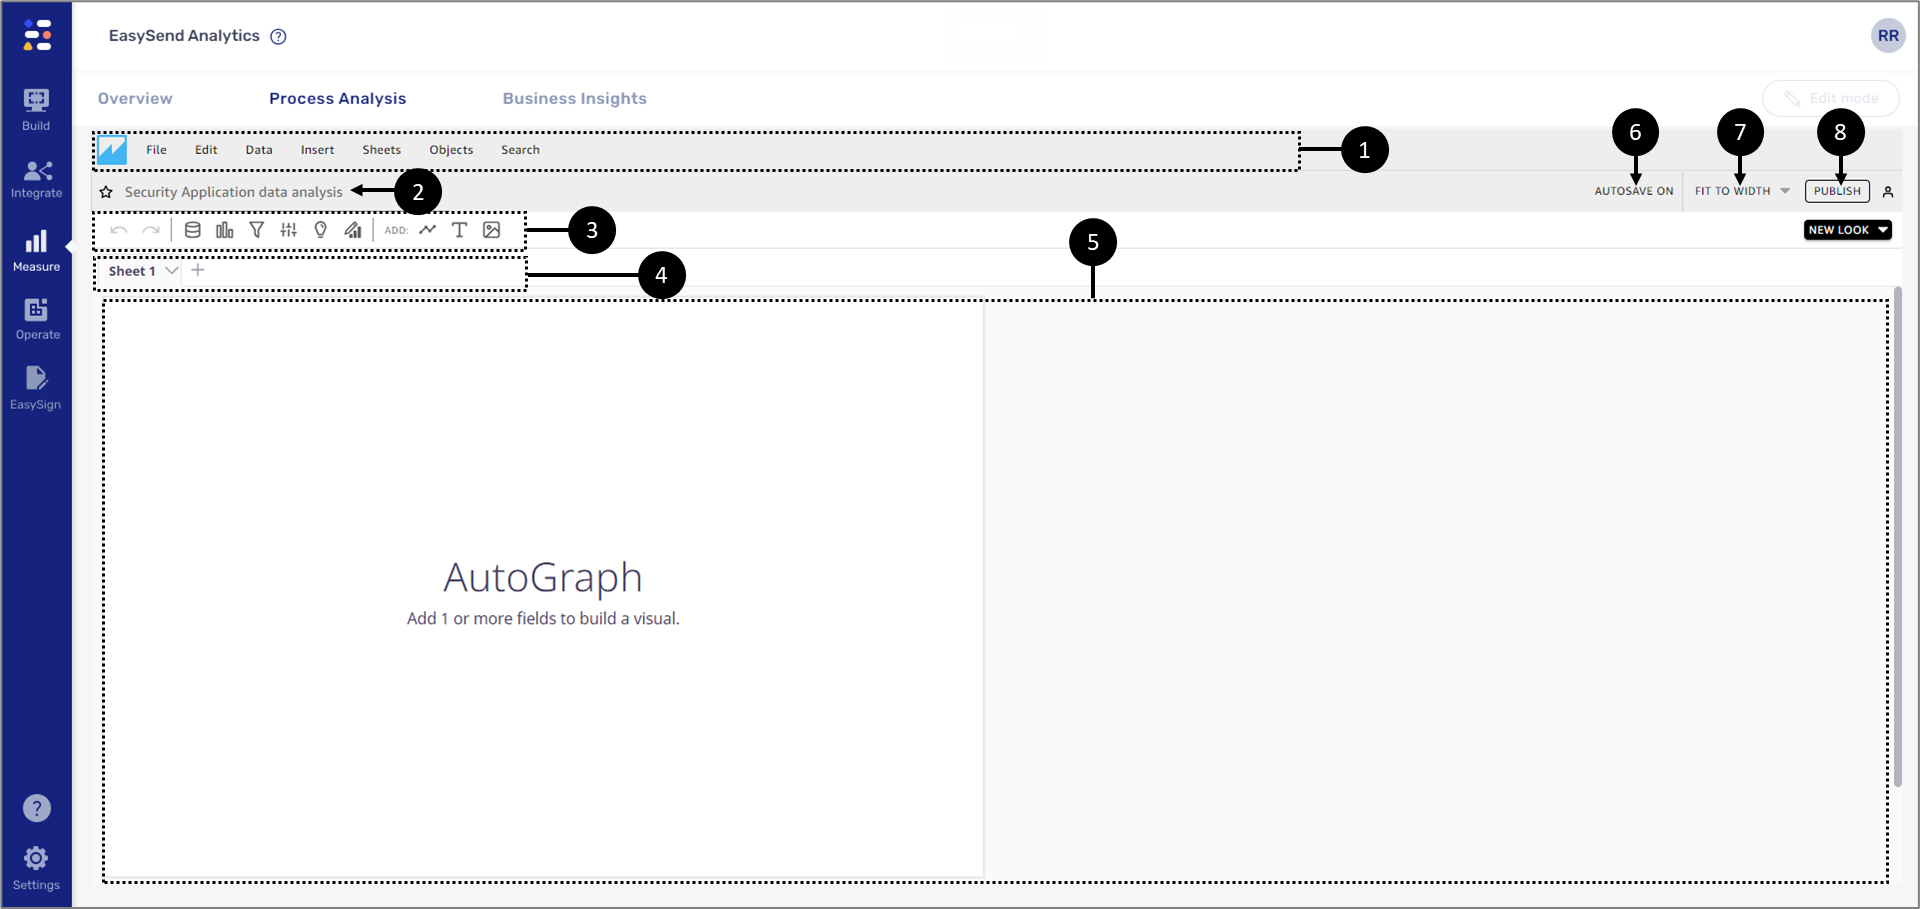
Figure 8: Analysis Screen Description
Table 1: Analysis Screen Description
No. | Section | Name | Icon | Description |
1 | Tabs bar | Back |  | Navigates back to the landing page |
| File | - | Enables to perform the following actions:
| ||
| Edit | - | Enables to perform the following actions:
| ||
| Data | - | Enables to perform the following actions:
| ||
| Insert | - | Enables to add to the analysis a new:
| ||
| Sheets | - | Enables to perform the following actions:
| ||
| Objects | - | Enables to perform the following actions:
| ||
| Search | - | Enables to search for analysis actions | ||
| 2 | - | Analysis name | - |
|
| 3 | Elements bar | Undo |  | Cancels a performed action |
| Redo |  | Restores a change that was undone | ||
| Datasets |  |
| ||
| Visualize |  |
| ||
| Filter |  | Enables to manage filters | ||
| Parameters |  | Not covered in this article | ||
| Insights |  | Not covered in this article | ||
| Properties |  | Enables to manage the properties of a visual | ||
| Add |  | Enables to add to the analysis a:
| ||
| 4 | Sheets | Sheet 1 | - | A sheet is a page that displays a set of visualizations, it is filled with charts, graphs, and tables NOTE Using the dropdown, a sheet can be duplicated or renamed |
| Add Sheet |  | Enables to add additional sheets to the analysis | ||
| 5 | - | Work area | - | The main work area |
6 | - | AUTOSAVE ON | - | Enables to switch between two states:
|
| 7 | - | FIT TO WIDTH | - | Enables to adjust the display of the analysis screen:
|
8 | - | Publish | - | Enables to publish the analysis as a dashboard |
Analysis Screen Elements
(See Figure 9)
When creating a new analysis, the analysis screen appears with the following default elements in the work area:
- Dataset + dataset fields (the dataset that was selected after clicking the New analysis button)
- Visuals
- Sheet 1 + AutoGraph visual
- Properties
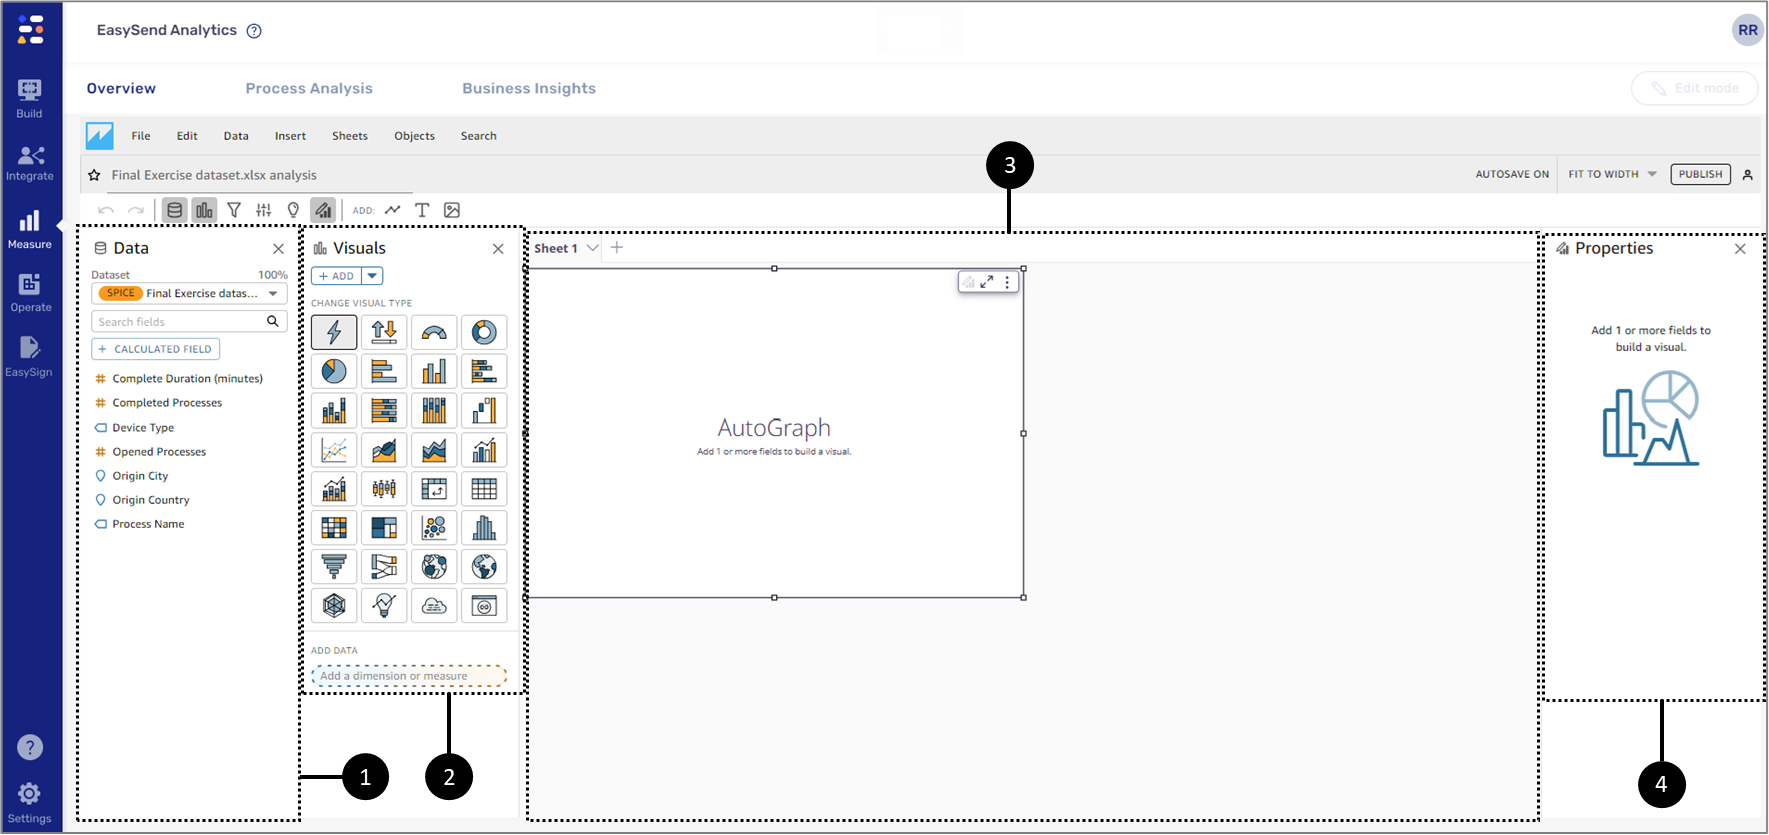
Figure 9: Analysis Screen Default Elements
 .
.Sheet Layout Settings
(See Figure 10 to Figure 14)
Before starting to work, it is recommended to select the sheet layout by clicking Sheets (1) and Layout Settings (2).
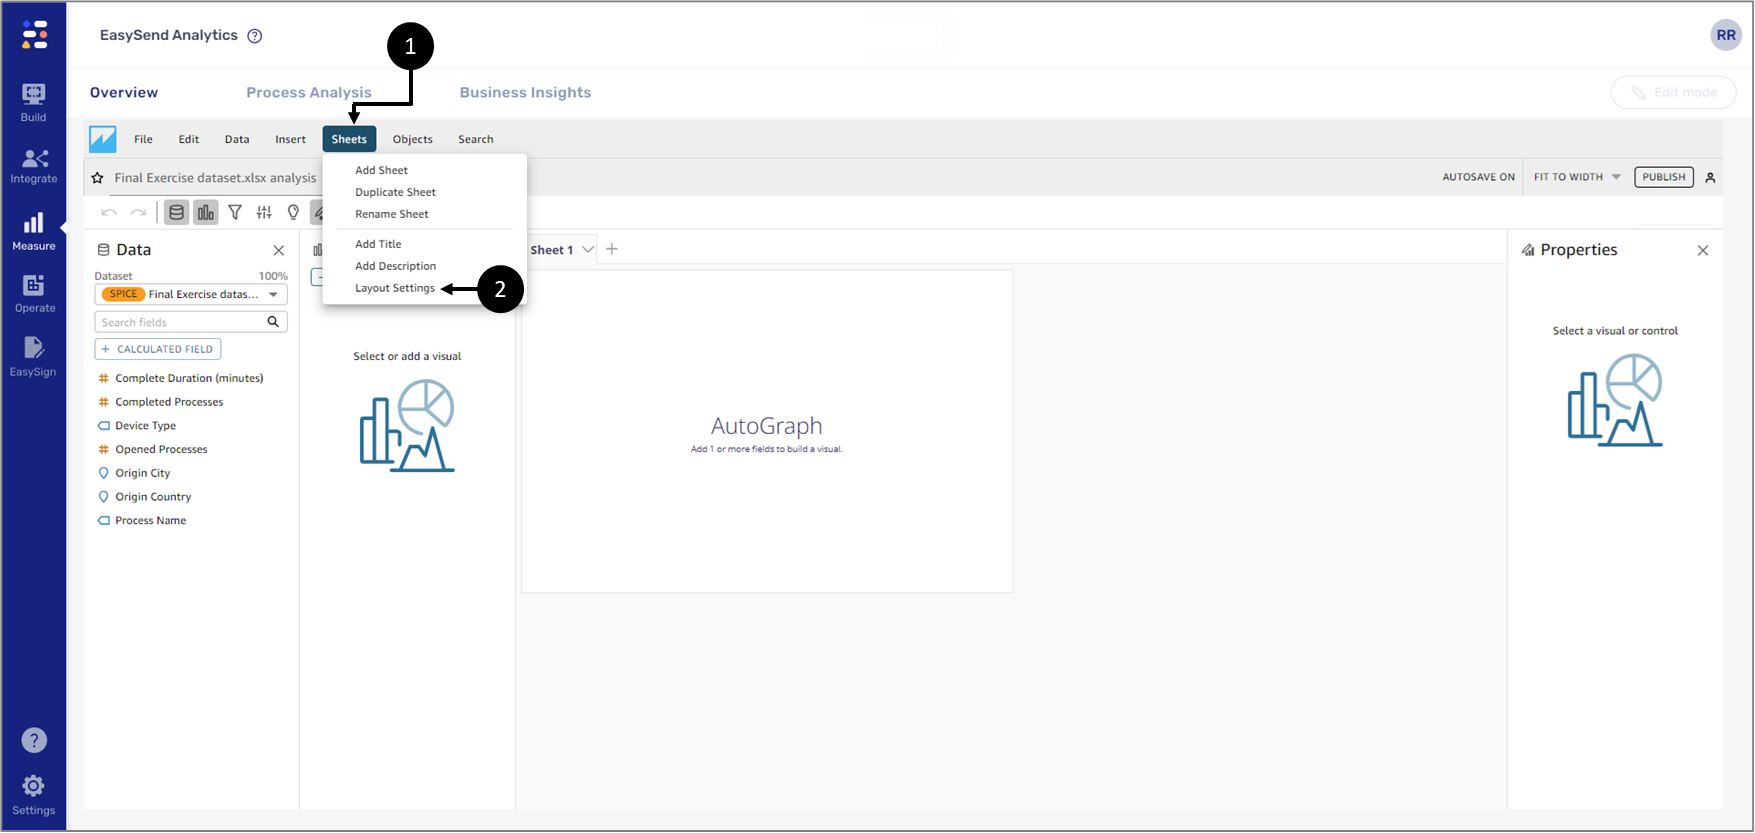
Figure 10: Sheets and Layout Settings
the Settings section displays the Sheet Layout options (3).
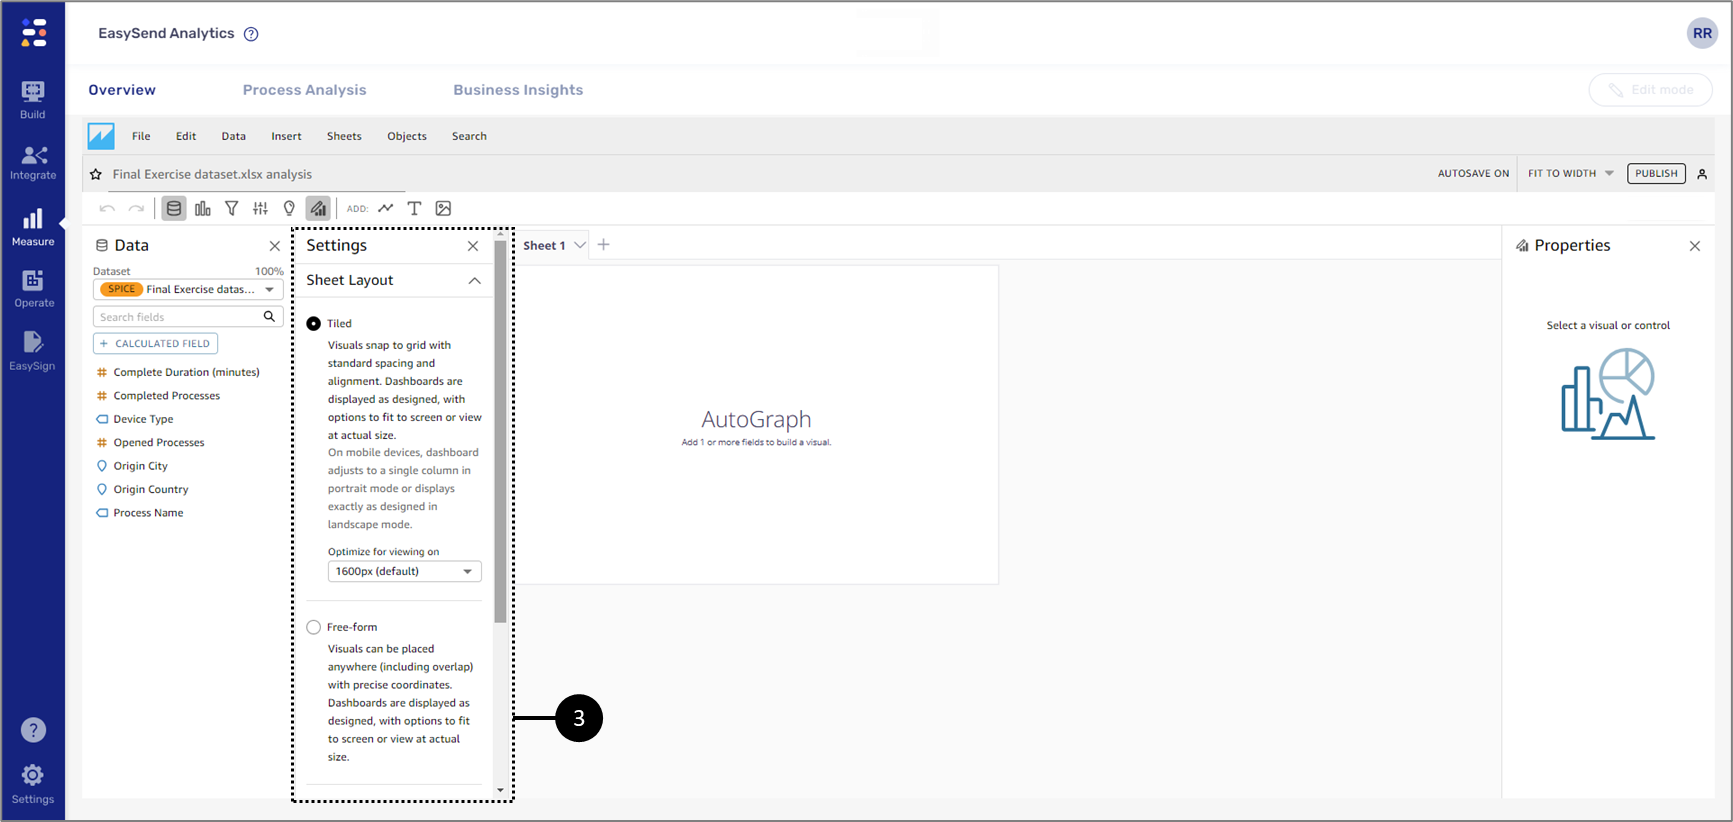
Figure 11: Settings and Sheet Layout
The layout options are:
- Tiled - visuals snap to grid with standard spacing and alignment. Dashboards are displayed as designed, with options to fit to screen or view at the actual size.
Figure 12: Tiled Layout
- Free-form - visuals can be placed anywhere (including overlap) with precise coordinates. Dashboards are displayed as designed, with options to fit the screen or view at the actual size.
The Free-form sheet layout must be selected when embedding EasySend’s custom backgrounds while creating custom visual content. For additional information see the Visual Types article.
Figure 13: Free-form Layout
- Classic - visuals snap to grid with standard spacing and alignment. Dashboards will hide data or change the formatting to fit smaller screen sizes.
Figure 14: Classic Layout