Article Overview
The following article describes how to publish and share dashboards so they will appear under the Business Insights tab.
What is Dashboard Publishing?
In EasySend analytics, a dashboard is a collection of charts, graphs, and insights. Dashboards come in a wide variety of designs, depending on your needs.
When you publish an analysis, that analysis becomes a dashboard that can be shared and interacted with by EasySend platform users in your environment.
You can choose to publish one sheet of an analysis, all sheets in the analysis, or any other combination of sheets that you want. When you publish an interactive sheet, that sheet becomes an interactive dashboard that users can interact with.
When Publishing a dashboard, you can customize the level of interactivity that your users have, including filter and search options. You can interact with the active items on the screen to filter, sort, drill down, or jump to another tool.
When viewing a dashboard, you're seeing the most recently received data. As you interact with the items on the screen, any changes you make change your view of the dashboard, and no one else's, thus, your device's privacy is assured.
How to Publish Dashboards
(See Figure 1 and Figure 2)
To publish dashboards, perform the following steps:
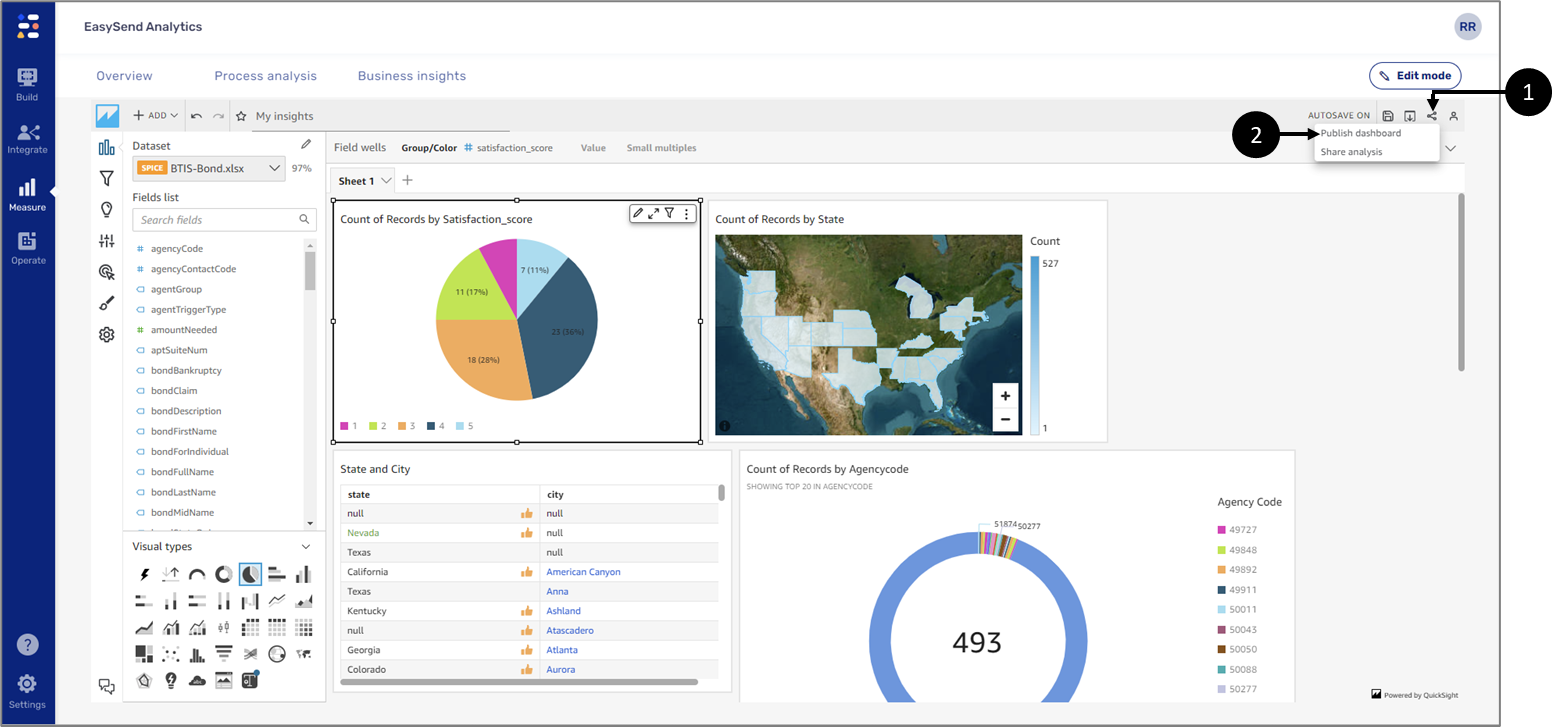
Figure 1: Publish Dashboard
- Open the analysis that you want to use.
- Click the share icon (1) and then click Publish dashboard (2).
Result:
The Publish a Dashboard window appears:
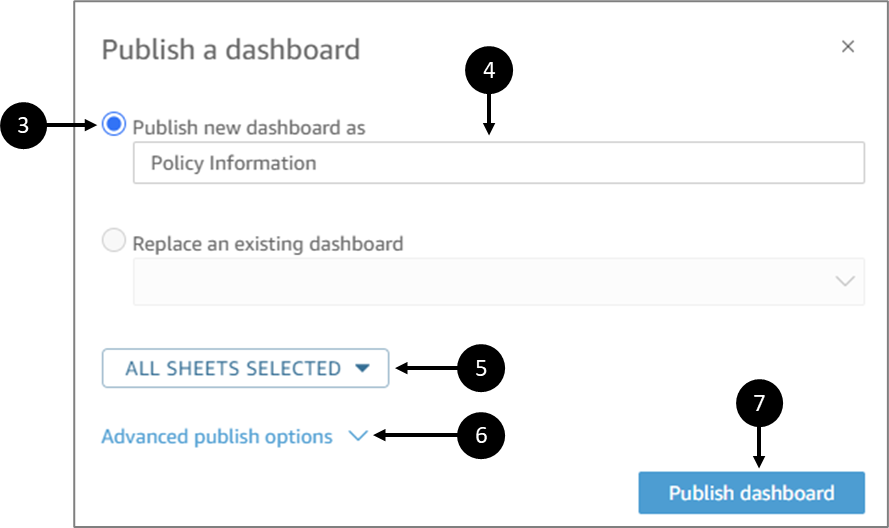
Figure 2: Publish a Dashboard Window
- To create a new dashboard, choose Publish new dashboard as (3), and then type a dashboard name (4).
- If required, click the dropdown (5) to select the sheets that you want to publish.
- Click the Advanced publish options dropdown (6) to configure additional options:
- For Dashboard options:
- Leave Expand on-sheet controls by default cleared to show a simplified view. This is disabled by default. To show the controls by default, turn on this option.
- Clear Enable advanced filtering on the left pane to remove the ability for dashboard viewers to filter the data themselves. If they create their own filters, the filters exist only while the user is viewing the dashboard. Filters can't be saved or reused.
- Clear Enable on-hover tooltip to turn off tooltips.
- For Visual options:
- Clear Enable visual menu, to turn off the on-visual menu entirely.
- Clear Enable download options if your dashboard viewers do not need to be able to download data from the visuals in the dashboard. The CSV file includes only what is currently visible in the visual at the time they download it. The viewer downloads data by using the on-visual menu on each individual visual.
- Clear Enable maximize visual option to turn off the ability to enlarge visuals to fill the screen.
- For Data point options:
- Clear Enable drill up/down if your dashboard doesn't offer drillable field hierarchies.
- Clear Enable on-click tooltip to turn off tooltips that appear when the reader chooses (clicks on) a data point.
- Clear Enable sort options to turn off sorting controls.
- Click Publish dashboard (7).
Sharing Dashboards
(See Figure 3 to Figure 9)
After creating and publishing a dashboard, to display it as part of your Business Insights, it is mandatory to add it to your shared folder:
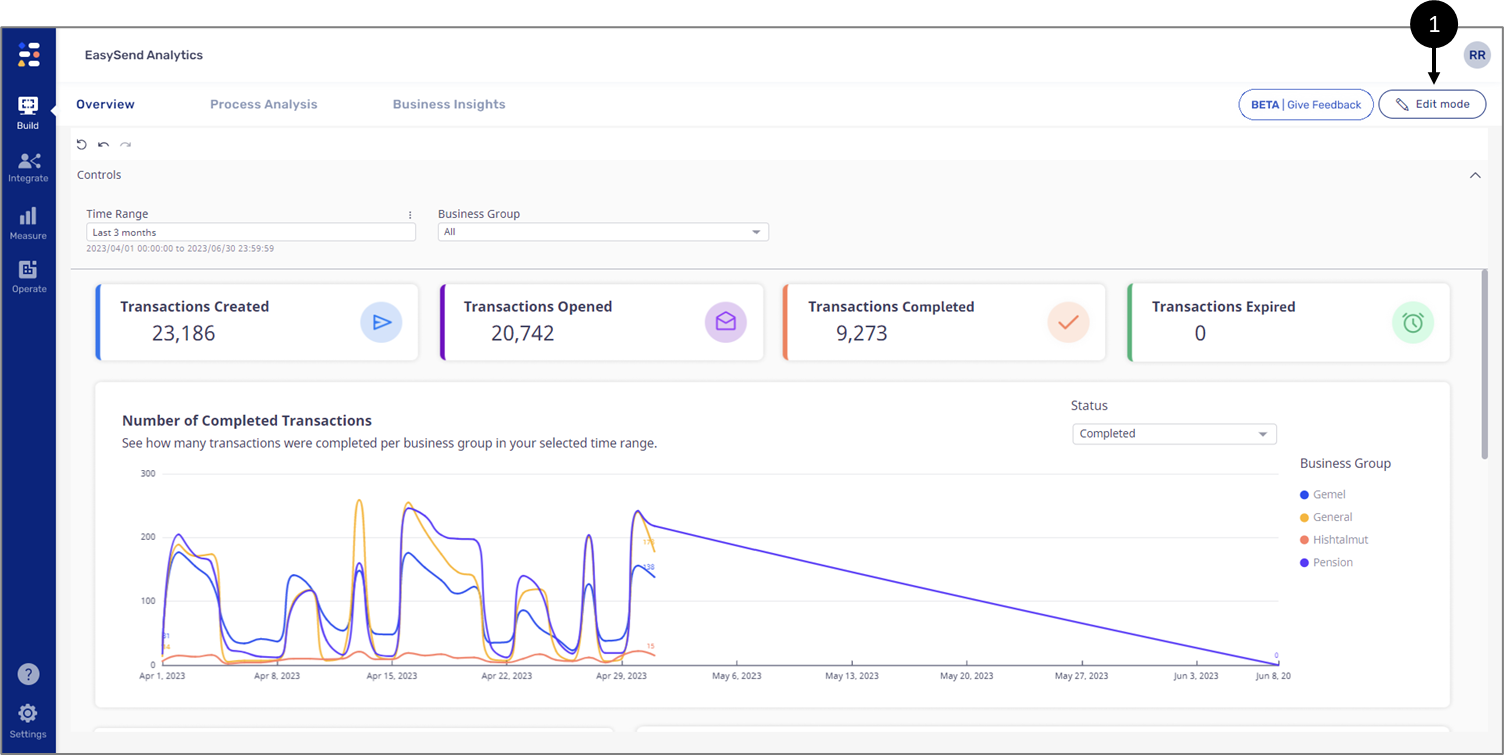
Figure 3: Edit Mode
- Click Edit Mode (1).
Result:
The authoring landing page appears:
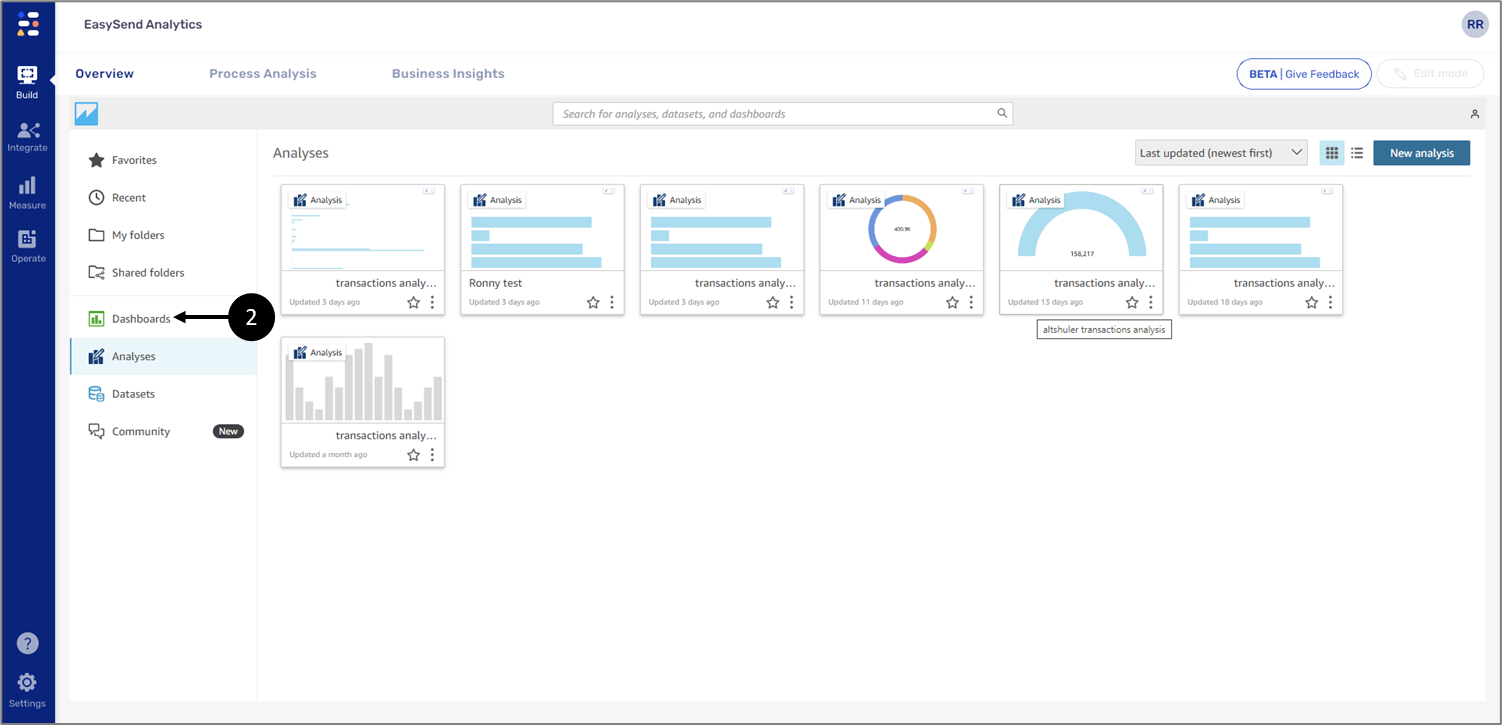
Figure 4: Landing Page
- Click Dashboards (2).
Result:
The Dashboards appear:
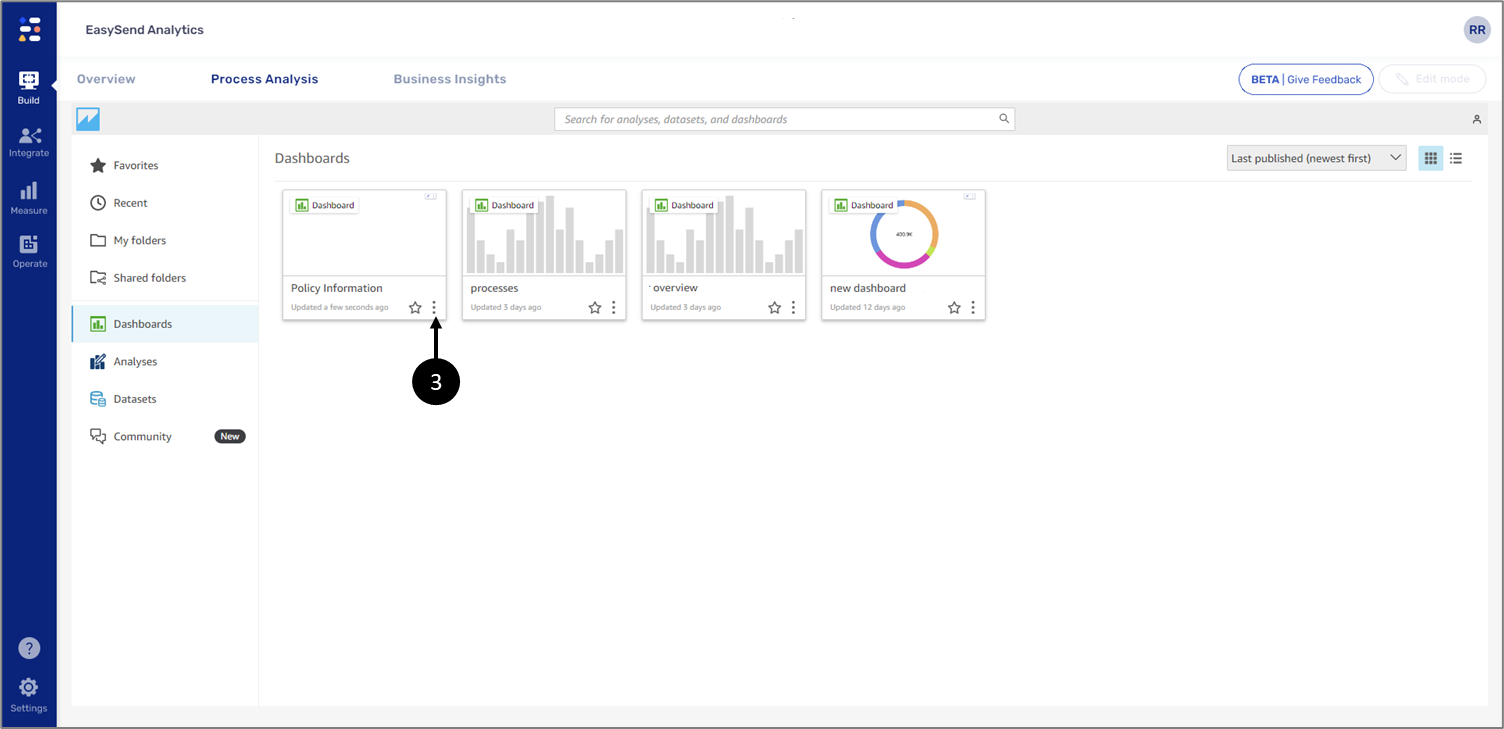
Figure 5: Dashboards
- Locate the relevant dashboard and click the three dots (3).
Result:
The following options appear:
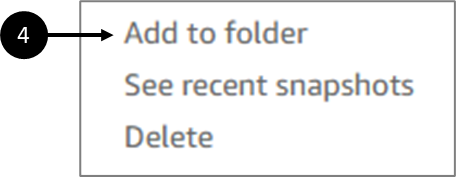
Figure 6: Add to folder
- Click Add to folder (4).
Result:
The Add to folder window appears:
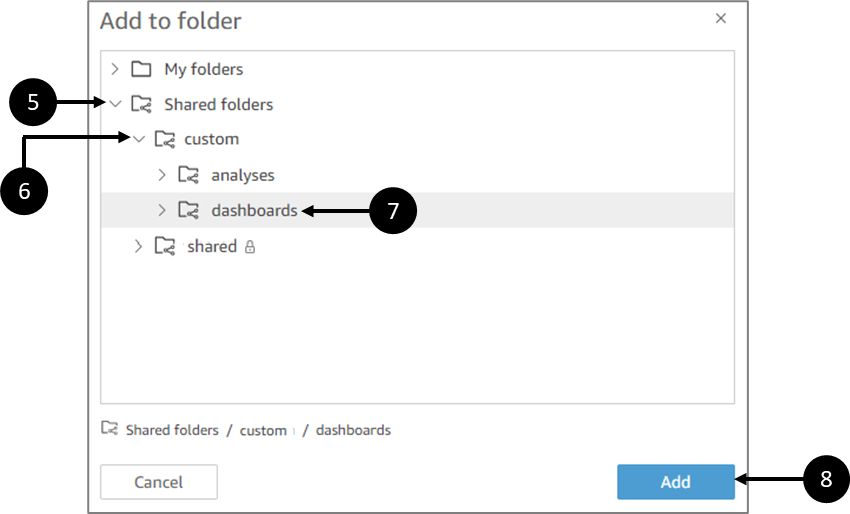
Figure 7: Add to folder Window
- Click the Shared folders (5) dropdown.
- Click custom (6).
- Click dashboards (7).
- Click Add (8).
Result:
The following window appears:
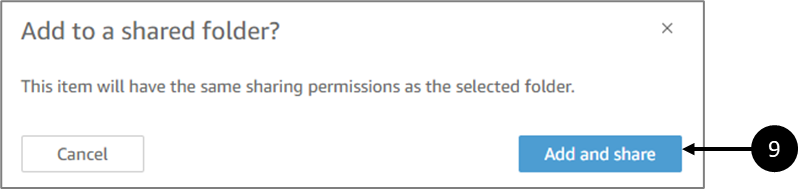
Figure 8: Add to folder Window
- Click Add and share (9).
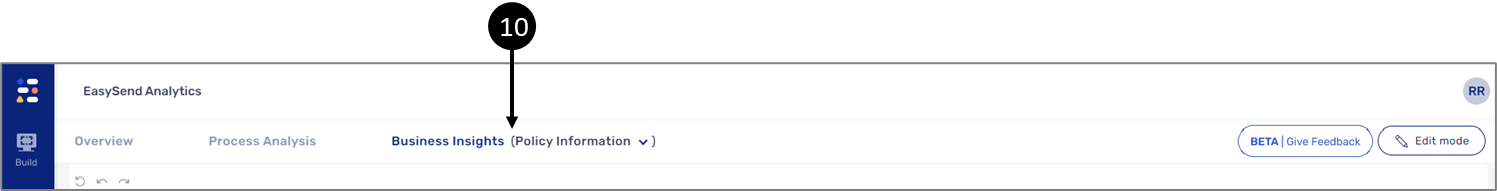
Figure 9: Business Insights
- Click the Business Insights tab and select the dashboard you published and shared (10).