Article Overview
The following article explores different monitoring and support tools you can use to maintain and troubleshoot your EasySend environment. The article also describes best practices for daily monitoring routines and a few examples of using the tools.
Platform Monitoring and Support Tools
EasySend's platform offers the following monitoring and support tools:
- Automatic Error Notifications
- Detailed Tracking Reports
- EasySend Analytics and Overview Reports
- Journey Tracker
- Transaction Log
How to Fully Utilize Your Monitoring and Support Tools
The following sections describe how to fully utilize your environment's monitoring and support tools.
Set Automatic Error Notifications (Send Error Email)
(See Figure 1 to Figure 2)
The Send Error Email feature notifies you (and other recipients) about transaction failures:
- Failure of services that run during the transaction - before the end-user submits the form
- Integration service failure - runs at the end of the transaction
- Internal EasySend errors - failures caused by the platform and cannot be handled by the Builder user
- The Email can also include process-related attachments:
- PDFs
- User-uploaded files
- Model JSON file
- To use this feature you must first upgrade your environment servers to version 36.6.6 and above.
To set automatic error notifications, perform the following steps:
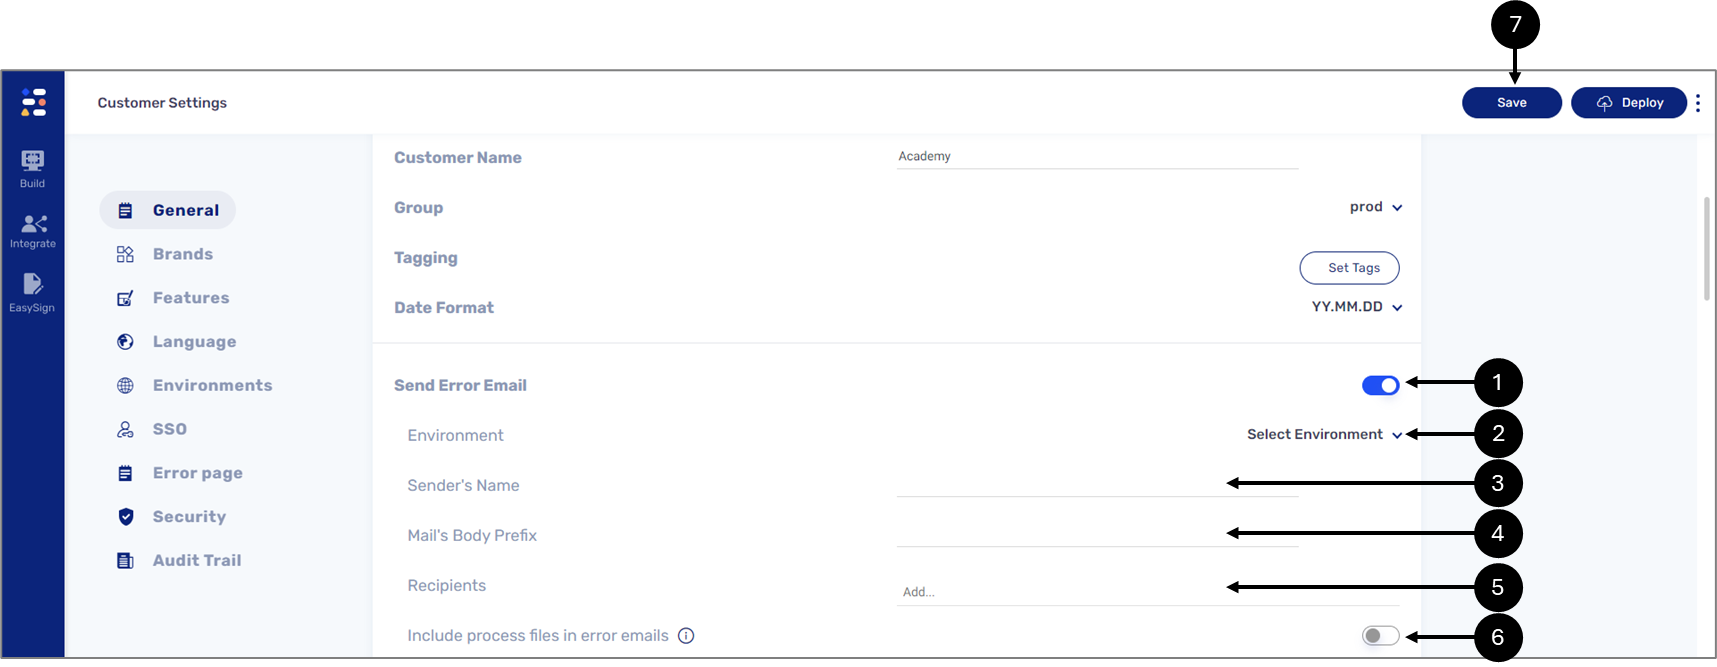
Figure 1: Send Error Email Feature
- On the Customer Settings screen, toggle the Send Error Email switch (1) to on.
The Customer Settings screen can only be accessed by EasySend, for further information, please contact our support team.
- Select the Environment (2).
- Set the Sender's Name (3).
- Write the content of the email (4).
- Add the Recipients (5).
- Repeat steps 2 to 5 to configure additional environments.
- If required, toggle the Include process files in error emails switch (6) to on.
To use this feature you must first upgrade your environment servers to version 36.6.6 and above.
- Click Save (7).
The received email will provide you with information about the transaction failure, for example:
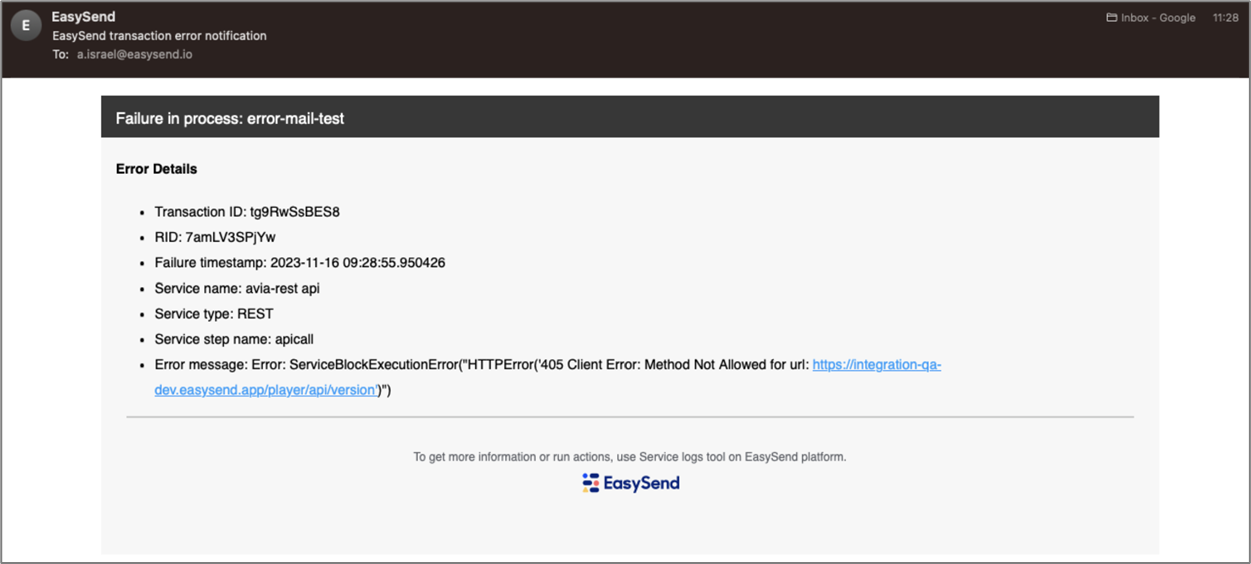
Figure 2: Send Error Email Example
The received email includes the following information:
- Transaction ID
- RID
- Failure timestamp
- Service name
- Service type
- Error message
- Process related attachments
Emails Failures Alerting
(See Figure 3 to Figure 4)
This feature sends a report to a specified email address that includes all the failed emails in a specific environment.
To set email failure alerting, perform the following steps:
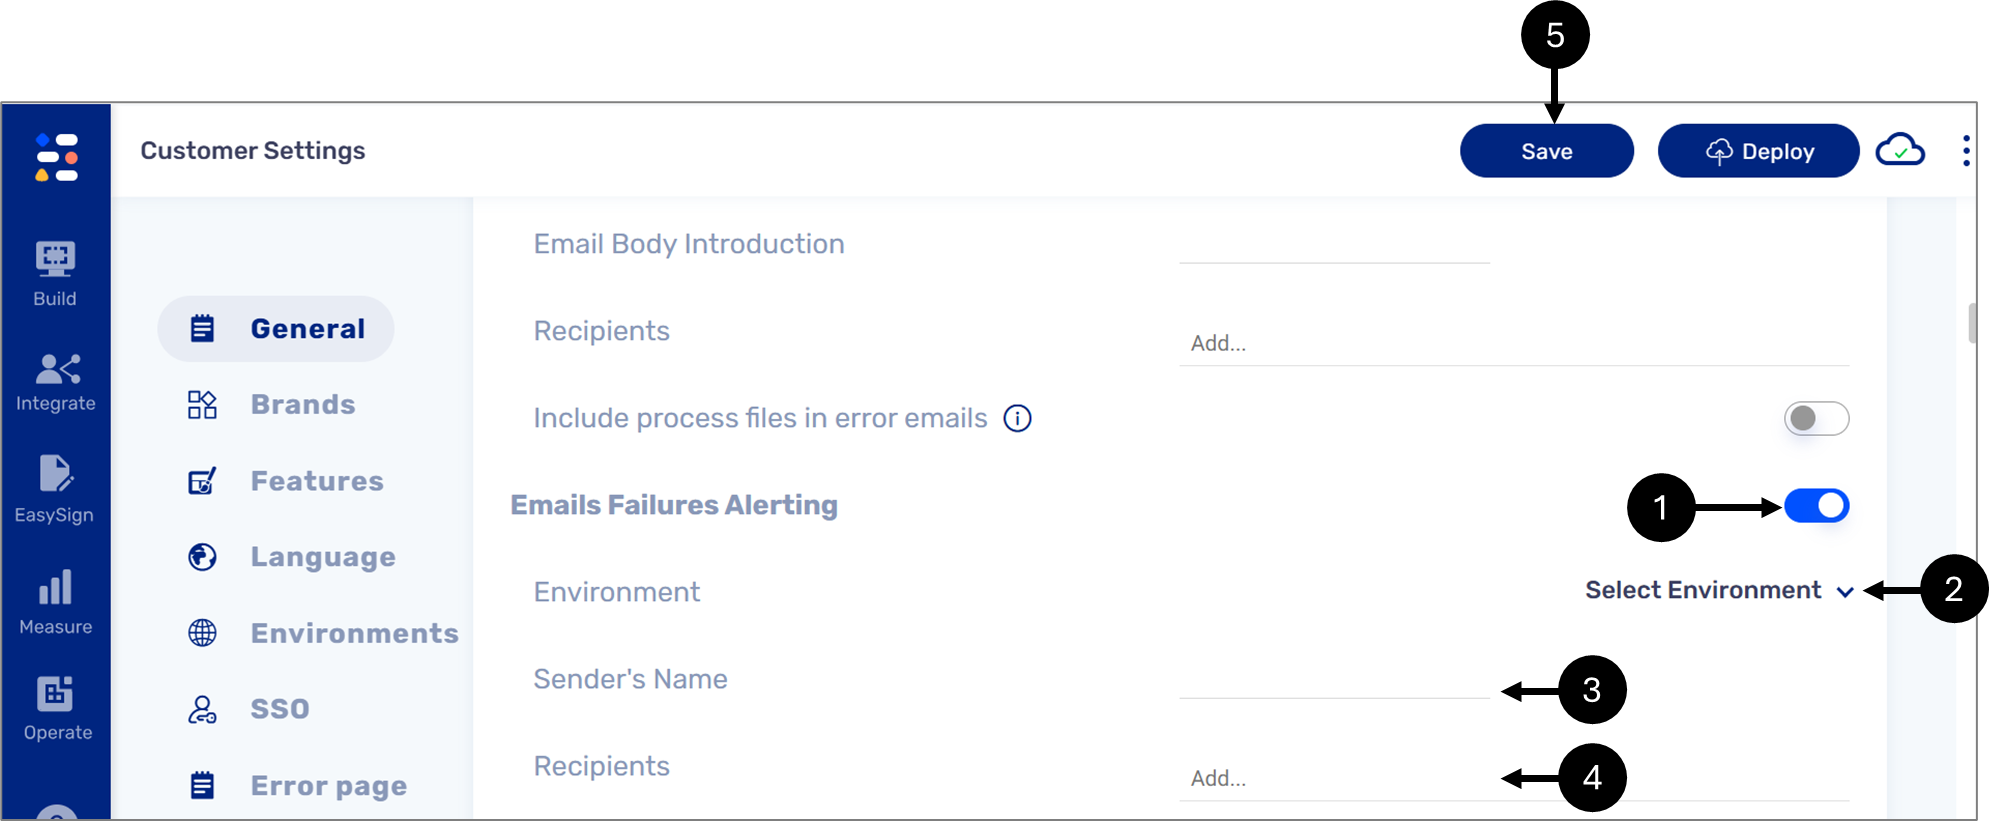
Figure 3: Email Failures Alerting
- On the Customer Settings screen, toggle the Email Failures Alerting switch (1) to on.
The Customer Settings screen can only be accessed by EasySend, for further information, please contact our support team.
- Select the Environment (2).
- Set the Sender's Name (3).
- Add the Recipients (4).
- Repeat steps 2 to 4 to configure additional environments.
- Click Save (5).
The received email will provide you with information about the failure, for example:
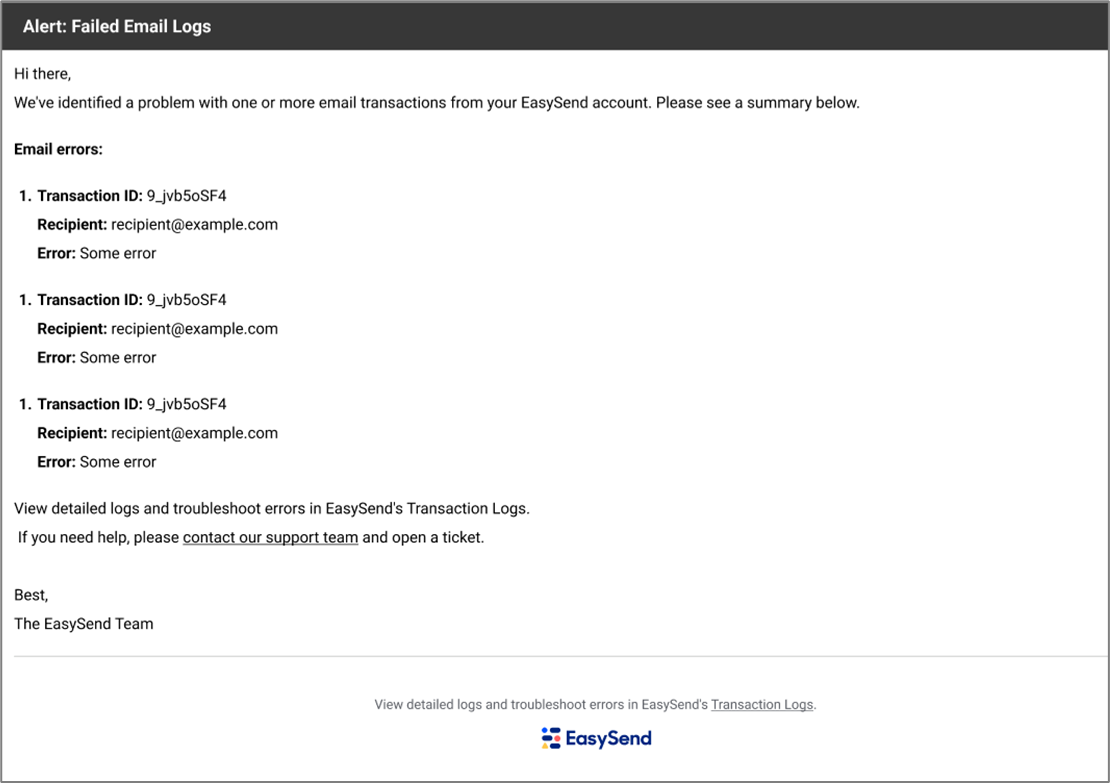
Figure 4: Email Example
The received email includes the following information:
- Transaction ID
- Recipient
- Error message
Create Detailed Tracking Reports
(See Figure 5 to Figure 8)
Using detailed tracking reports you can receive scheduled reports and monitor the performance of your transactions.
To create a detailed tracking report, perform the following steps:
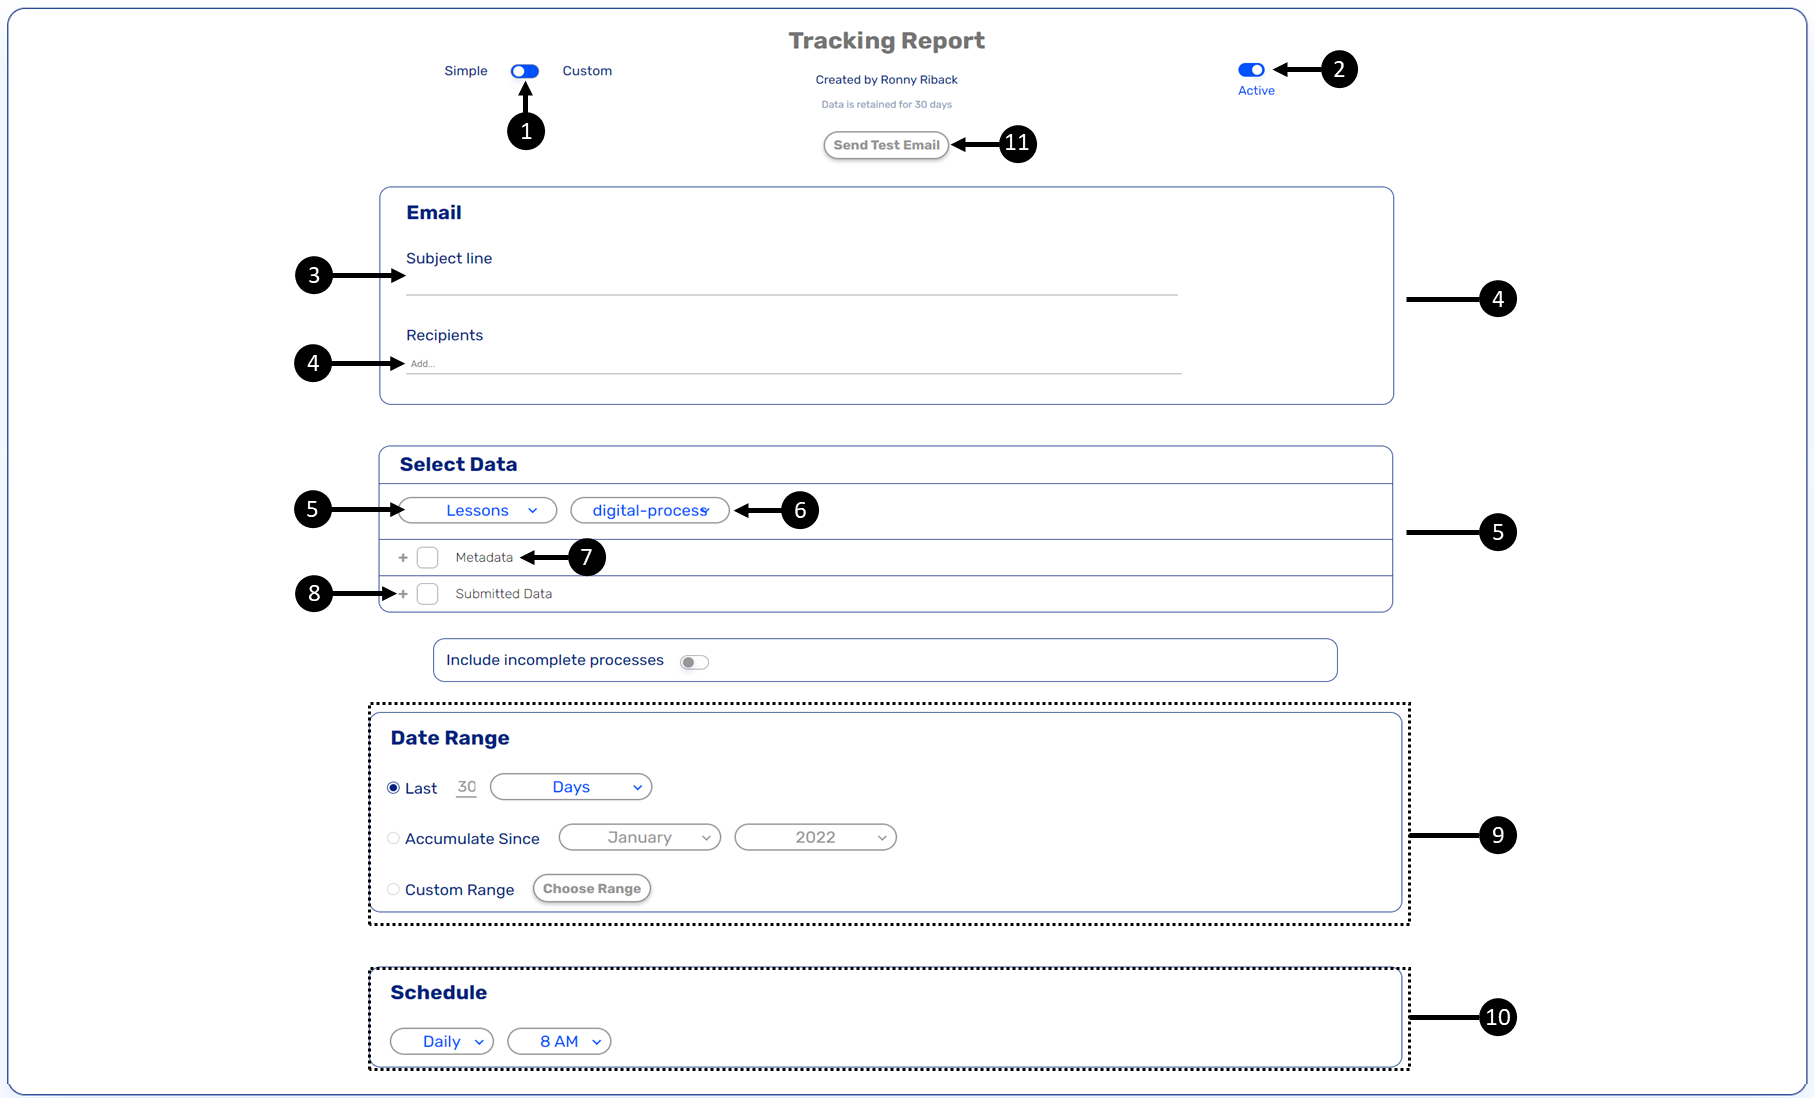
Figure 5: Creating a Simple Data Report
- Verify that the Simple/Custom switch (1) is set to Simple.
- Verify that the Active/Paused switch (2) is set to Active.
- Enter the subject of the email (3).
- Add the recipients (4).
- Select the business group (5) and the process (6).
- Select the desired metadata (7) and the desired submitted data (8).
- Set the data range (9).
- Set the schedule to determine when the report will be sent automatically (10).
- To evaluate the reception of the email with the report and view it, click the Send Test Email
button (11).
Result:
The Send Test Email window appears:

Figure 6: Send Test Email Window
- Select the desired recipients, either the same Report Receptions (12) you added in
step 4 or Alternative Report Receptions (13). - Click the Ok button (14).
A report is sent as an Excel sheet via email to the added recipients:
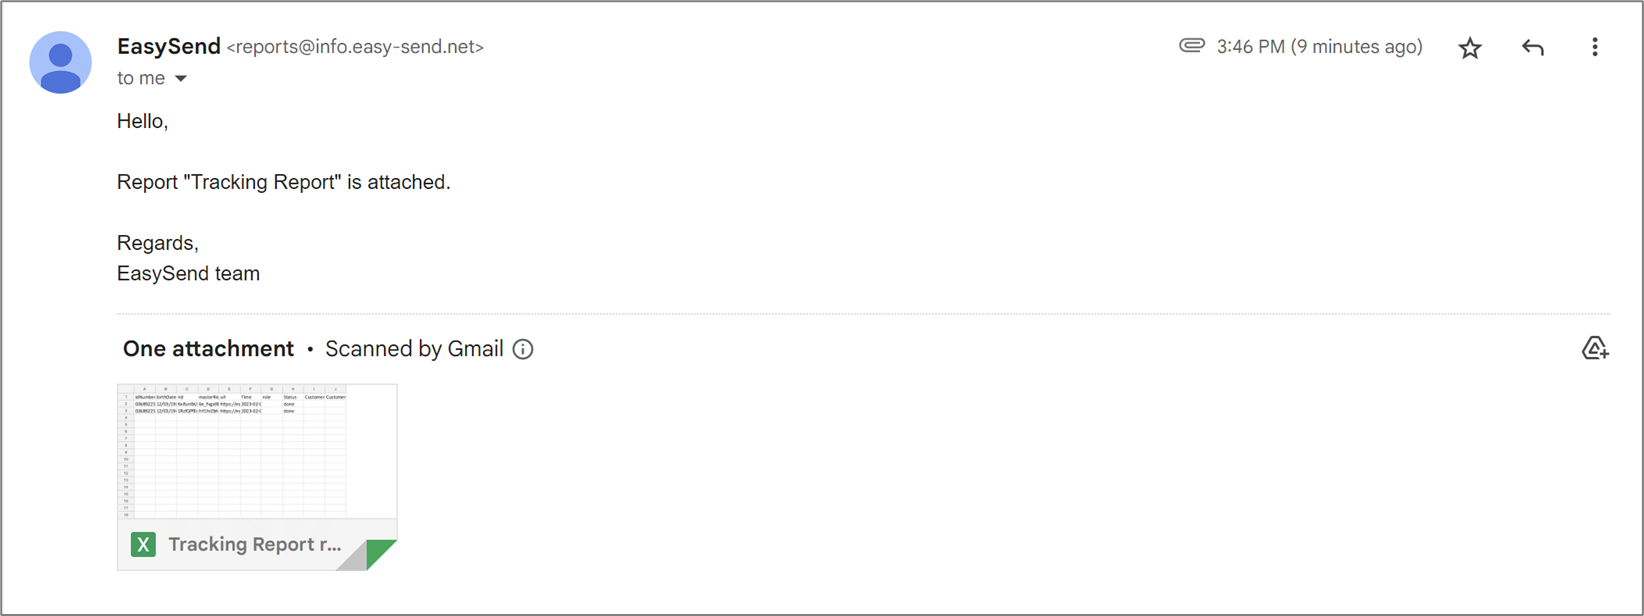
Figure 7: Email Example
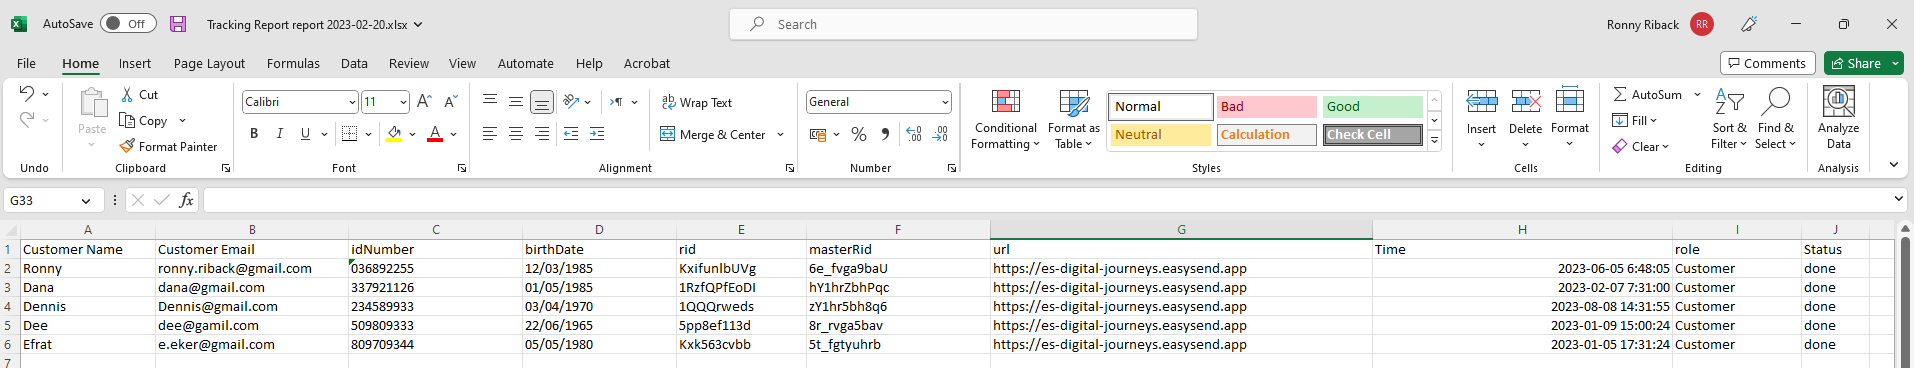
Figure 8: Report Example
EasySend Analytics and Overview Reports
EasySend’s analytics module was created to empower customers to make better data-driven business and operational decisions while boosting their business outcomes.
Each customer has personalized responsive dashboards that enable them to view different information such as:
- Processes conversion rates
- Organizational performance evaluation
- Revenue analysis
- Trends identification
Data in the dashboards is displayed in a rich variety of visualization types that can be adjusted to different filters.
Create Overview Reports
(See Figure 9)
Overview reports are statistical reports that provide an overview of digital processes and contain data about how many transactions were:
- Created
- Opened
- Completed
The report displays the number of transactions in different stages and not the number of events that happened to a transaction. Displaying the number of transactions and not the number of events makes the dashboard more intuitive for users to understand.
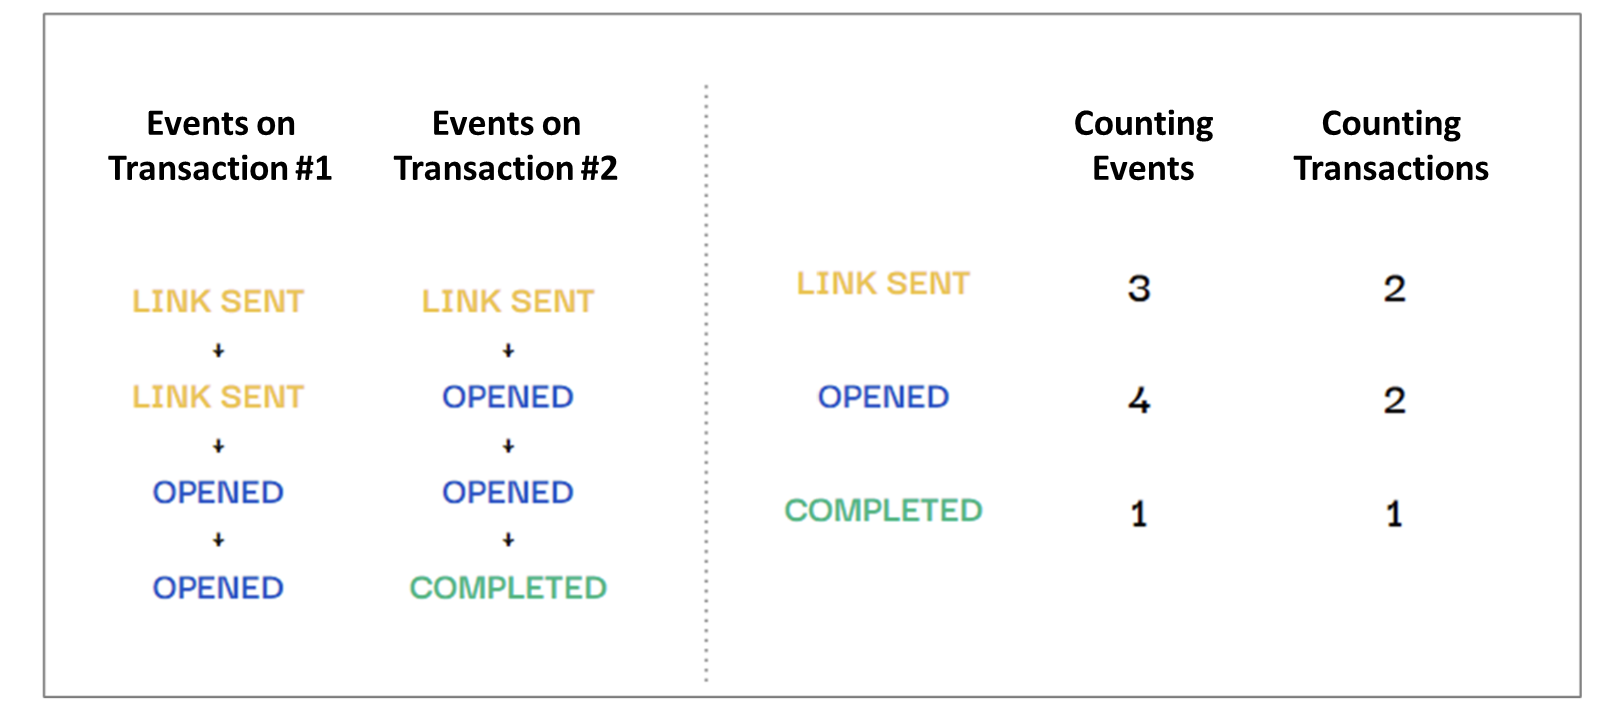
Figure 9: Analytics Dashboards Logic
Creating an Overview Report
(See Figure 10 to Figure 13)
To create a simple report, perform the following steps:
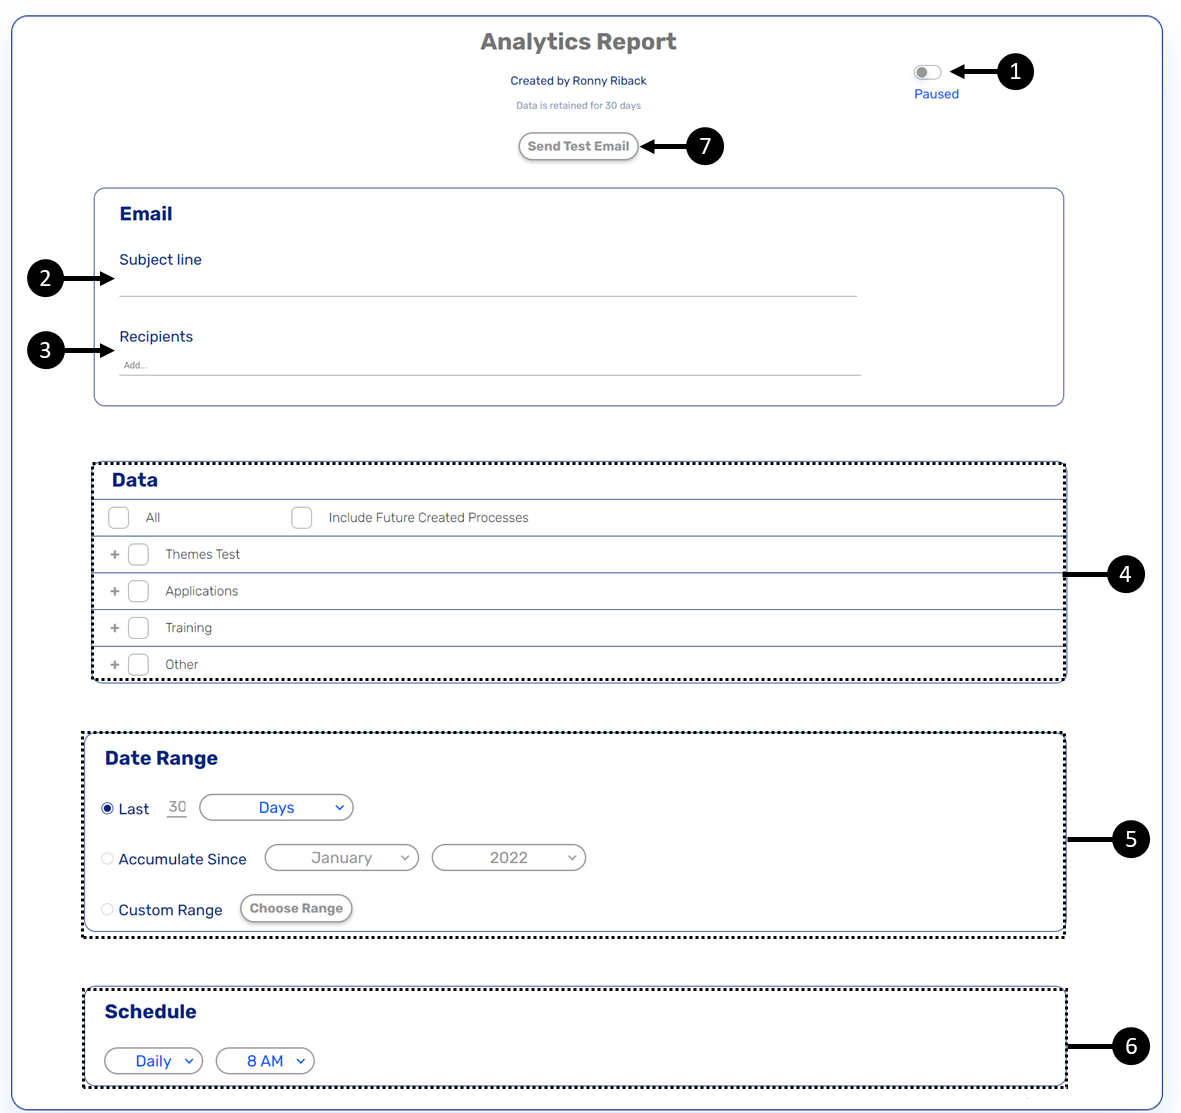
Figure 10: Creating a Simple Data Report
- Verify that the Active/Paused switch (1) is set to Active.
- Enter the subject of the email (2).
- Add the recipients (3).
- Select the Data (4), business group, and processes.
- Set the data range (5).
- Set the schedule to determine when the report will be sent automatically (6).
- To evaluate the reception of the email with the report and view it, click the Send Test Email
button (7).
Result:
The Send Test Email window appears:
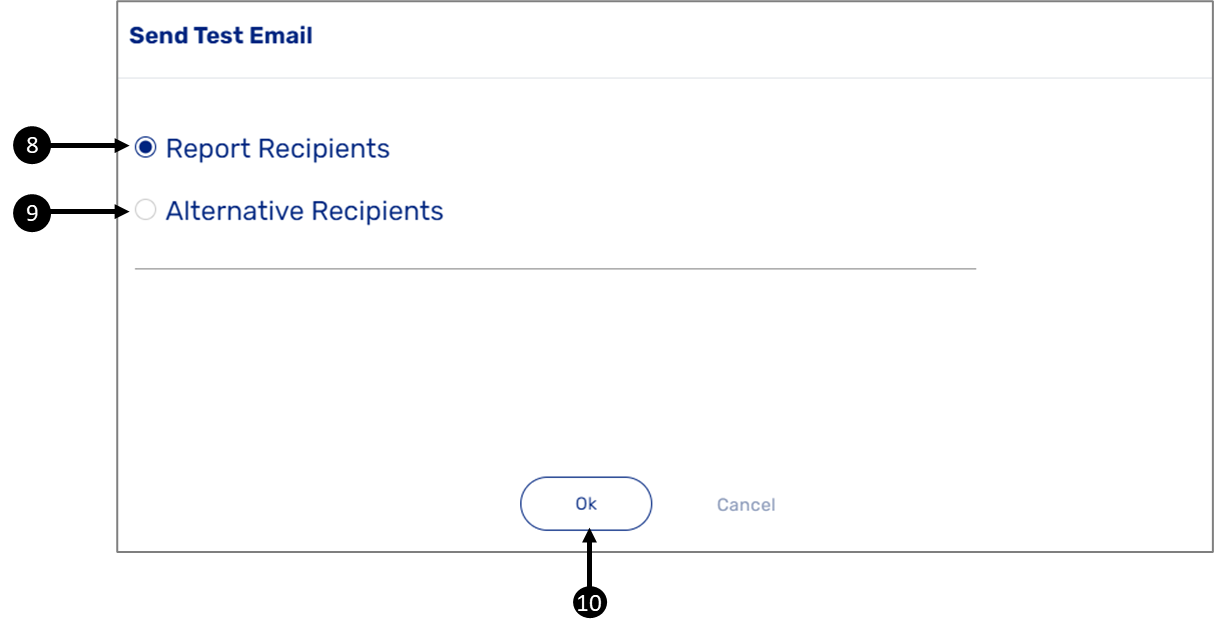
Figure 11: Send Test Email Window
- Select the desired recipients, either the same Report Receptions (8) you added in
step 3 or Alternative Report Receptions (9). - Click the Ok button (10).
A report is sent as an Excel sheet via email to the added recipients:
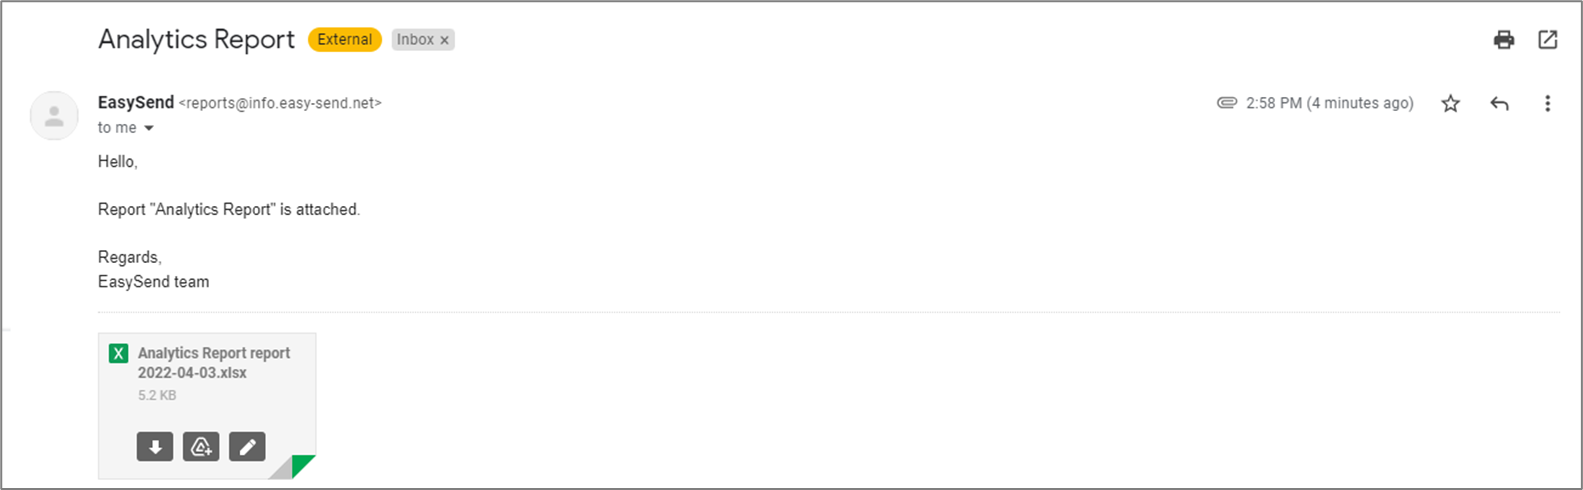
Figure 12: Email Example
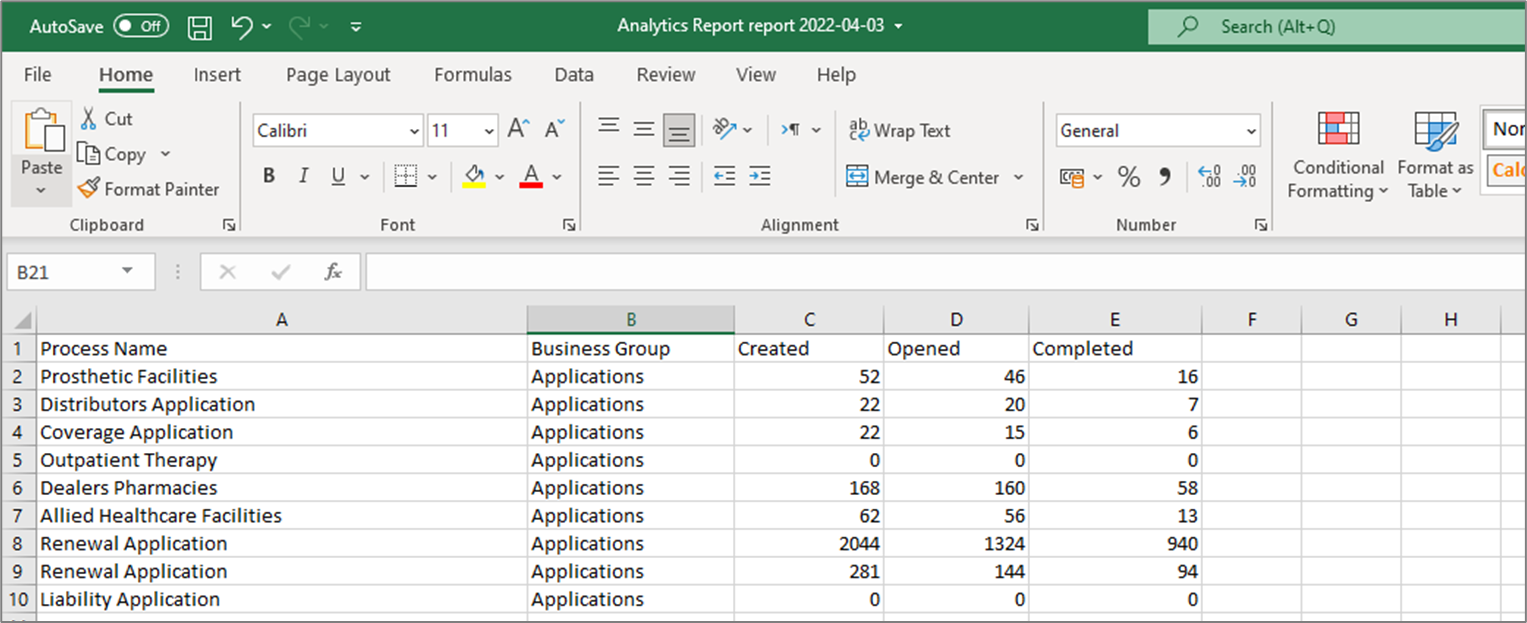
Figure 13: Report Example
Track Processes Using the Journey Tracker
(See Figure 14 and Figure 15)
The Journey Tracker feature enables you to track your live processes and view the status of their different stages. The information the Journey Tracker displays is saved for 30 days maximum.
The Journey Tracker displays a list of tracked processes that were deployed to a production environment. Each tracked process displays the following information:
- Process Name
- Time - the time when the process's status last changed
- Sender - the name of the sender (empty by default)
- Customer Name
- Customer Phone
- Customer Email
- Status - the current status of the process:
- Link-Sent - a link to the process was sent to a recipient
- Opened - the link was clicked and opened by the recipient
- Data Submitted - a recipient submitted a process step.
- Reminder-Sent - a reminder to finish the process (or one of its steps) was sent to a recipient
- Completed-Step - a recipient completed one of the process's steps
- Completed (PROCESS COMPLETED) - the entire process was completed
- Cancelled - the link of the process was canceled and is no longer accessible
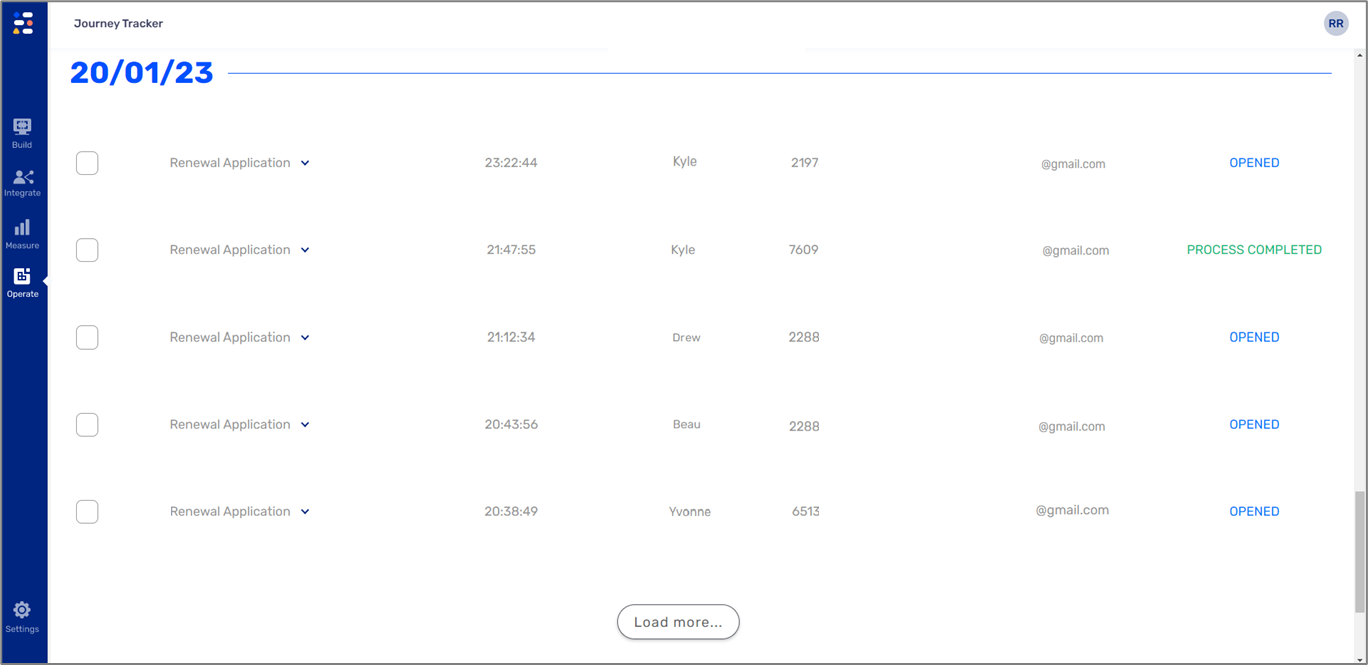
Figure 14: Tracking List
The Load more.. button loads and displays additional processes for tracking, up to the last 30 days.
When clicking a process from the list, detailed tracking information appears:
- masterRID (1) - a unique identifier of an EasySend transaction.
- Status list:
- The date when the process's status changed
- The time when the process's status changed
- The status
- Customer Name
- Role
- RID - a unique identifier of an EasySend step. The RID is nested under the masterRID. When creating a transaction, it can be divided into steps, for example, when using the Workflow Manager. Each step will receive its own unique RID as part of its URL, for example, player-demo.easysend.app/customer/onboarding/page0/0?lang=en&rid=qDzVpy_U7gY
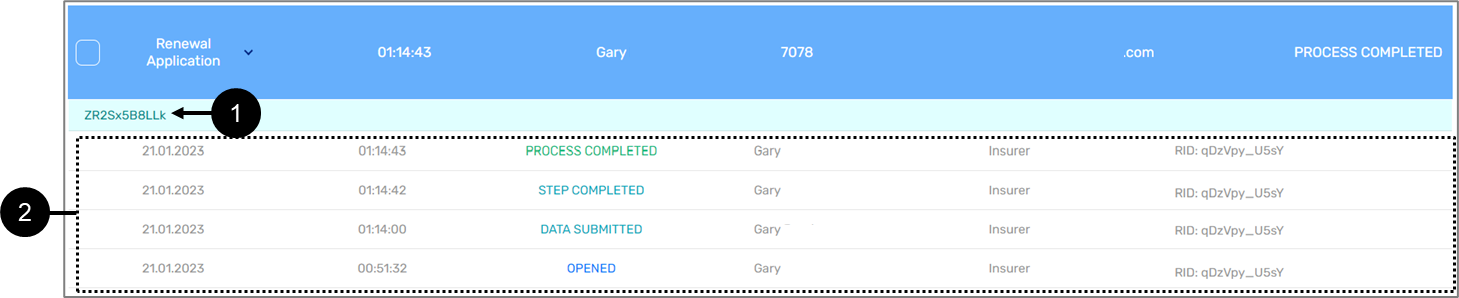
Figure 15: Detailed Tracking Information
Explore the Transaction Log
The Transaction Log screen is an operational tool that enables platform users to receive a detailed view of the status of their transactions and manage them. Using the Transaction Log screen, platform users can maintain, investigate, and troubleshoot different issues by performing the following actions:
- Locating a transaction or a group of transactions, by using flexible filters and new free text search capabilities.
- Understanding transaction status and delving into multiple services and steps.
- Monitor any kind of failed service execution - during or at the end of the transaction, read the error message, or download a log file.
- Check email status directly from the email vendor platform, for example: opened by the end-user or rejected.
- Download email attachments.
- Resume transactions and re-run transactions and services.
- Monitor webhooks and retries.
Monitoring Routine Actions - Best Practices
The following actions are recommended to perform daily to make sure your environment is fully protected from operational and technical failures:
- Check your email for automatic error notifications.
- Make sure the sender name is set and easy to spot.
- Set tags or a designated email box to receive and group the automatic error notifications.
- View your scheduled detailed tracking reports and your overview reports.
- Make sure the email subject is set and easy to spot.
- Set tags or a designated email box to receive and group the reports.
- Save the reports locally on your machine to create an archive.
- View your Analytics dashboard to learn about end-users interactions with your digital processes:
- Check how many transactions were created, opened, and completed.
- See if you can spot any gaps with the numbers.
- If gaps are found, drill down to the page-level analytics and view specific page data.
- Write down any discrepancies, you will use the information within the Journey Tracker.
- Access the Journey Tracker and drill down different transactions and view their current step status. Start with transactions you investigated using the Analytics Dashboard. View the current step of a transaction and learn information such as:
- Who is the user interacting with the transaction in its current step?
- What is the status of the current step?
- Explore the Service Logs:
- Check the status of your transactions.
- If while using the Journey Tracker you found a "suspicious" transaction, copy its masterRID, paste it in the Service Logs filter, and explore it:
- Check the status.
- Drill down to the services and check their status.
- Investigate the service's JSON files.
- Drill down to steps and check their status.
- Investigate the steps in JSON files.
- If needed, re-submit transactions and/or services.
Examples
The following sections describe examples of using the monitoring and support tools for troubleshooting across your environment.
Uncompleted Transaction
(See Figure 16 to Figure 20)
If a transaction started and is not complete you can use the monitoring and support tools to explore and investigate the problem:
- Check your email for any automatic error notifications.
- If a relevant email was found check it for relevant information, for example:
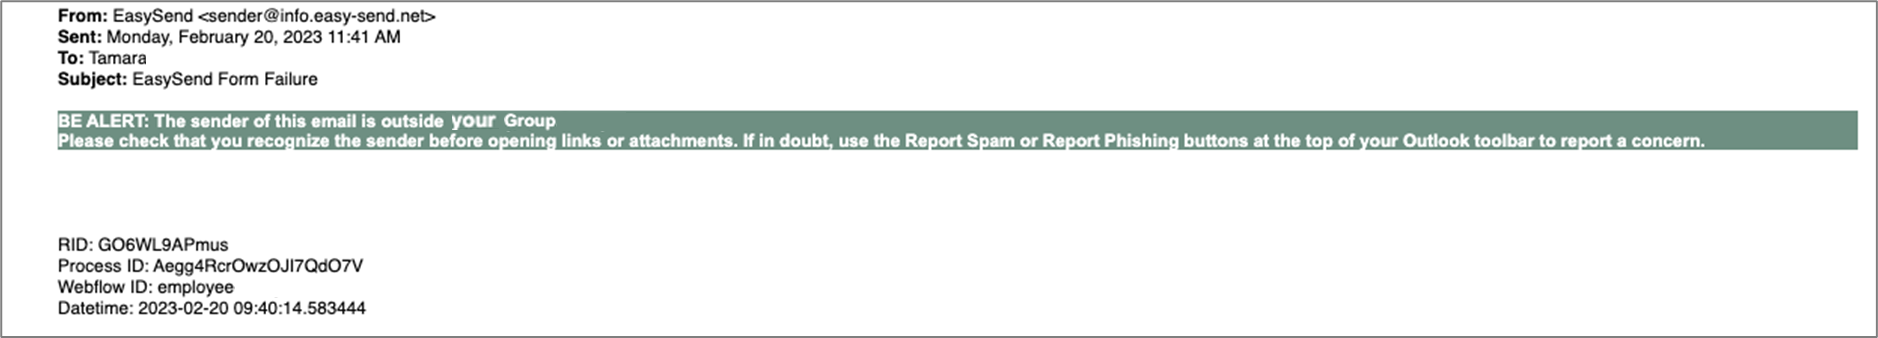
Figure 16: Automatic Error Notification Example
- Error description.
- RID.
- Process and Webflow ID.
- Timestamp.
- Check your detailed tracking reports and locate the transaction to learn more information, for example:
Figure 17: Detailed Tracking Report Example
- Navigate to the Analytics Dashboard and check the events of other transactions from the same digital process, was it a problem with a specific transaction or all of them?
- Drill down to the page level analytics and view:
- Which pages were reached?
- How much time was spent on a page?
- What are the completion and conversion rates?
- What is the number of errors?
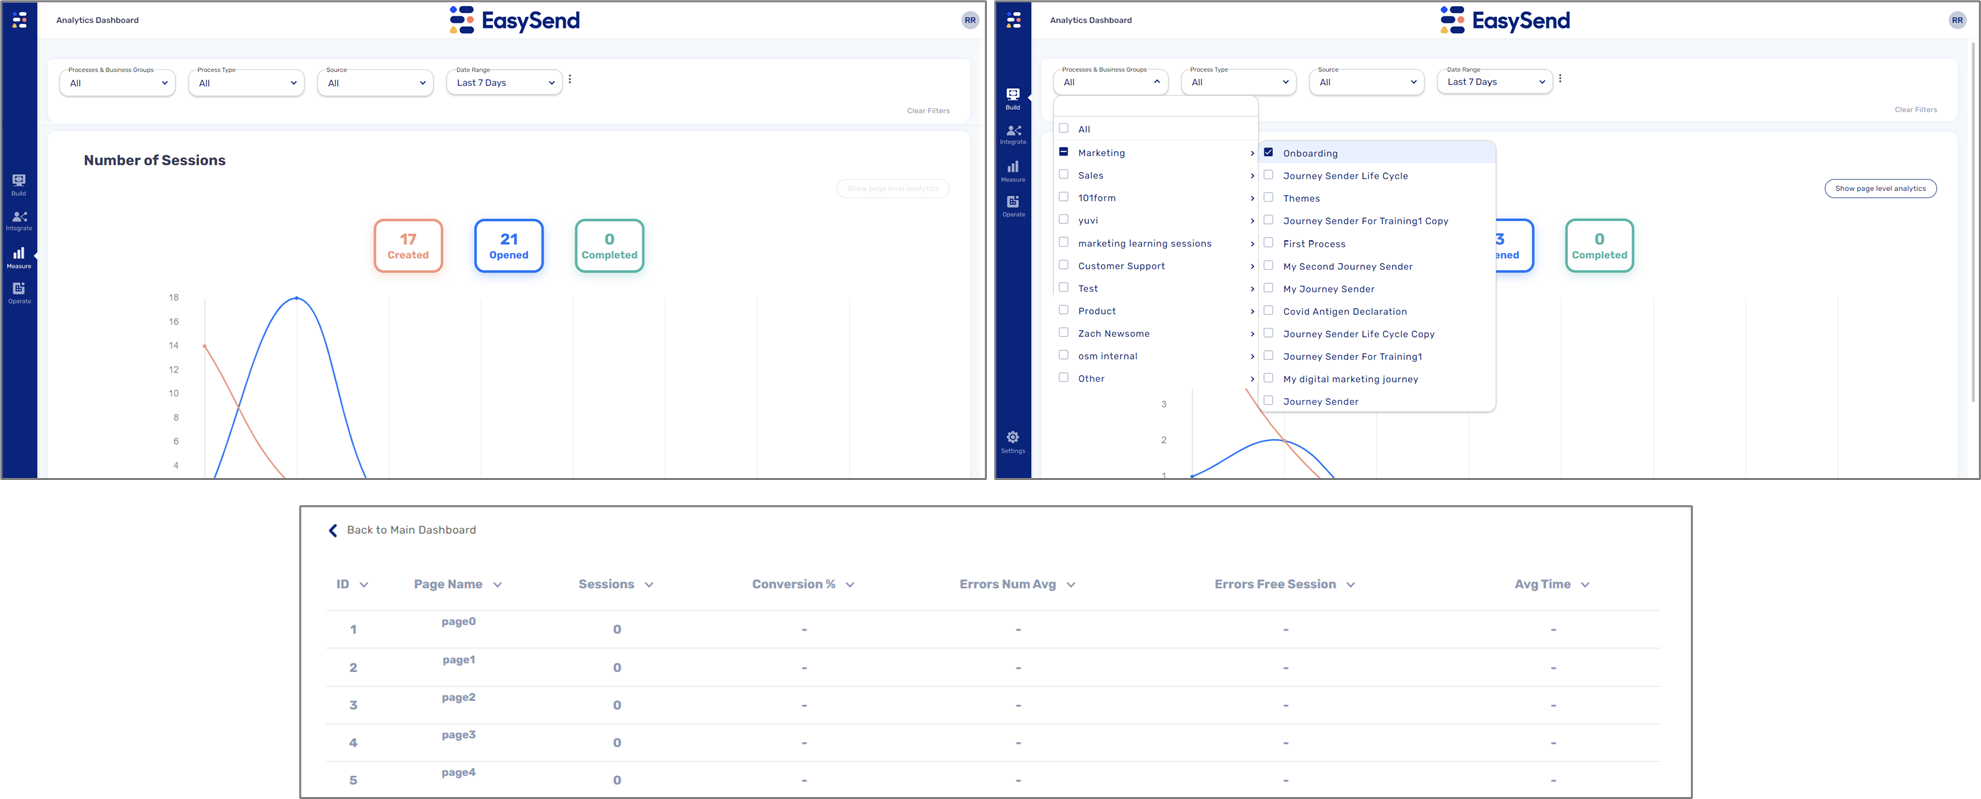
Figure 18: Analytics Dashboard and Page Level Analytics
- Open the Journey Tracker screen, locate the transaction, using the masterRID, and drill down to see the status of its steps, for example:

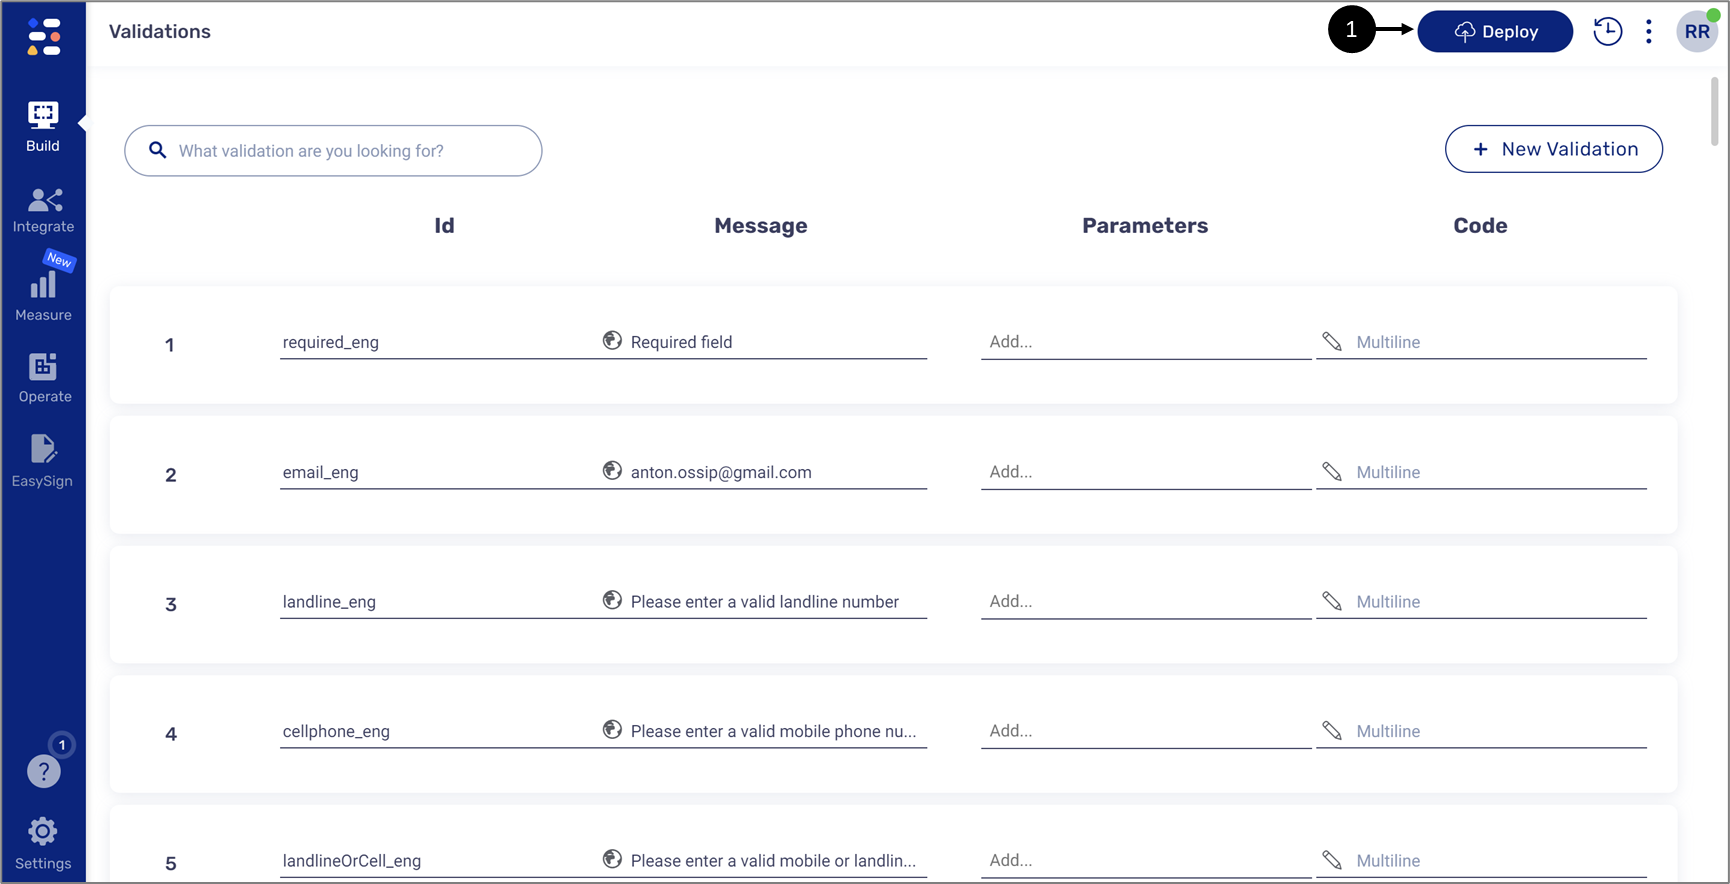
Figure 19: Journey Tracker
- Explore the Service Logs, locate the transaction, using the masterRID, and perform the following steps:
- Check its status
- Click the transaction and drill down to view its services.
- If a service has a failed status, download and view its JSON file.
- Return to the service, click it, and drill down to its steps,
- If a step has a failed status, download and view its JSON file.
- If necessary, Re-Run the transaction or its services.
Figure 18 summarizes the steps of the process:

Figure 20: Process Steps