Article Overview
The following article describes how to debug player errors.
What are Player Errors?
Player errors are runtime errors that occur while interacting with a digital process, causing it to behave unexpectedly or terminate abnormally. These errors cannot be detected during deployment because they depend on end-user input and/or service state. These types of errors only appear while the digital process runs. For example, player errors can be:
- Formula calculation failure
- Computed code error
- Conditioning failure
How to Manage Player Errors
EasySend provides a debugger tool that allows implementors to identify and understand issues through effective error handling and clear messaging in the Player, enabling them to resolve problems independently.
When an issue occurs, an error message will be shown in the dev-tools, console, with all the relevant details that are available and related to the problem.
The Debugger
The following sections describe EasySend's debugger.
Advantages
(See Figure 1)
A debugger for locating Player errors is an invaluable tool for implementers, improving efficiency, code quality, and overall productivity by supplying detailed insights into program execution and enabling quick resolution of issues. It provides the following advantages:
- Efficient error identification - pinpointing the exact location where an error occurs, saving time compared to manually combing through code.
- Real-time analysis - allowing implementers to monitor changes in real-time.
- Immediate feedback - providing immediate feedback when errors occur, displaying error messages and relevant information.
- Learning and Skill Development - helping implementers learn more about the digital processes they are building.
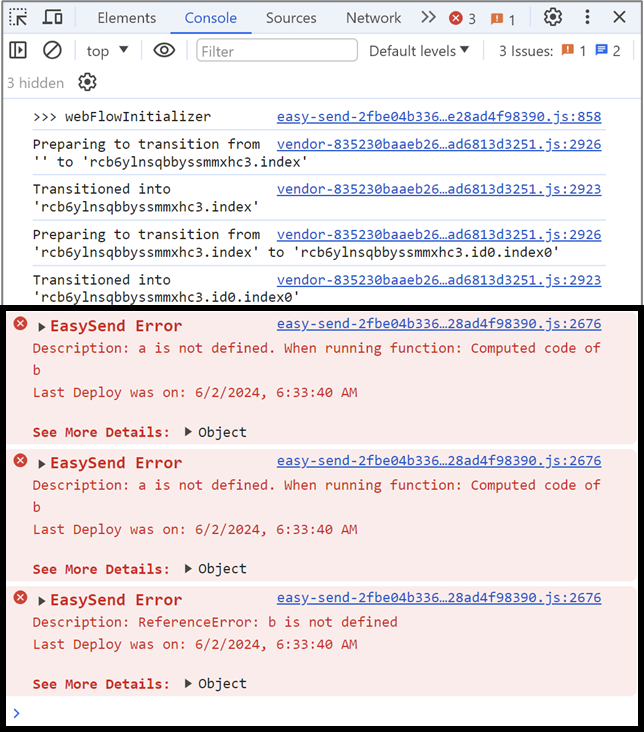
Figure 1: Player Errors Debugger Example
How to Access
(See Figure 2 to Figure 4)
When previewing a digital process from the builder and there are any Player errors - the implementor can view the debugger by accessing the Console. There are two different ways to access it:
- By clicking F12 and then Console.
- Right-clicking anywhere on the digital process, clicking Inspect, and then Console.
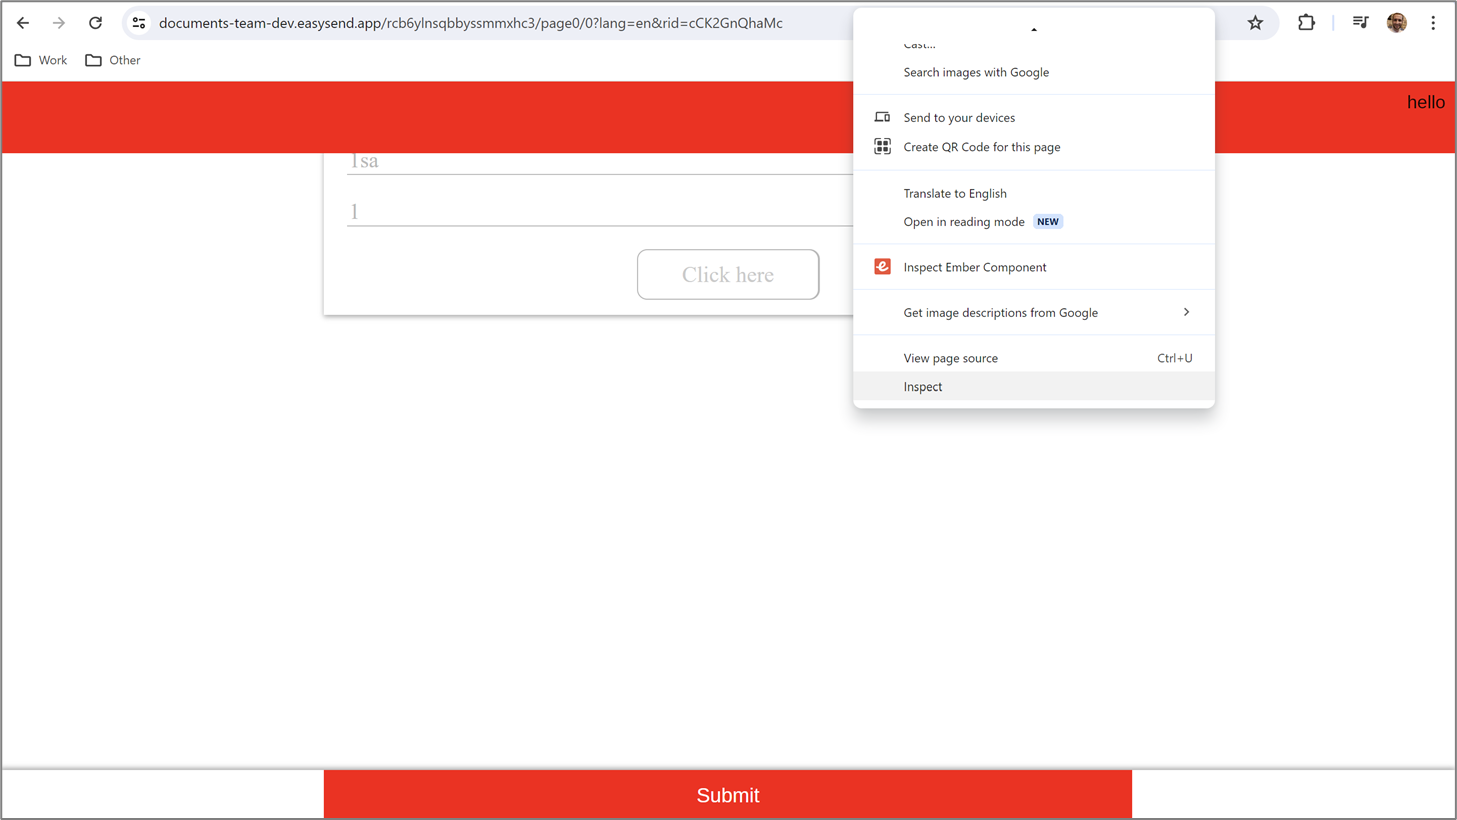
Figure 2: Accessing the Debugger Part 1 of 2
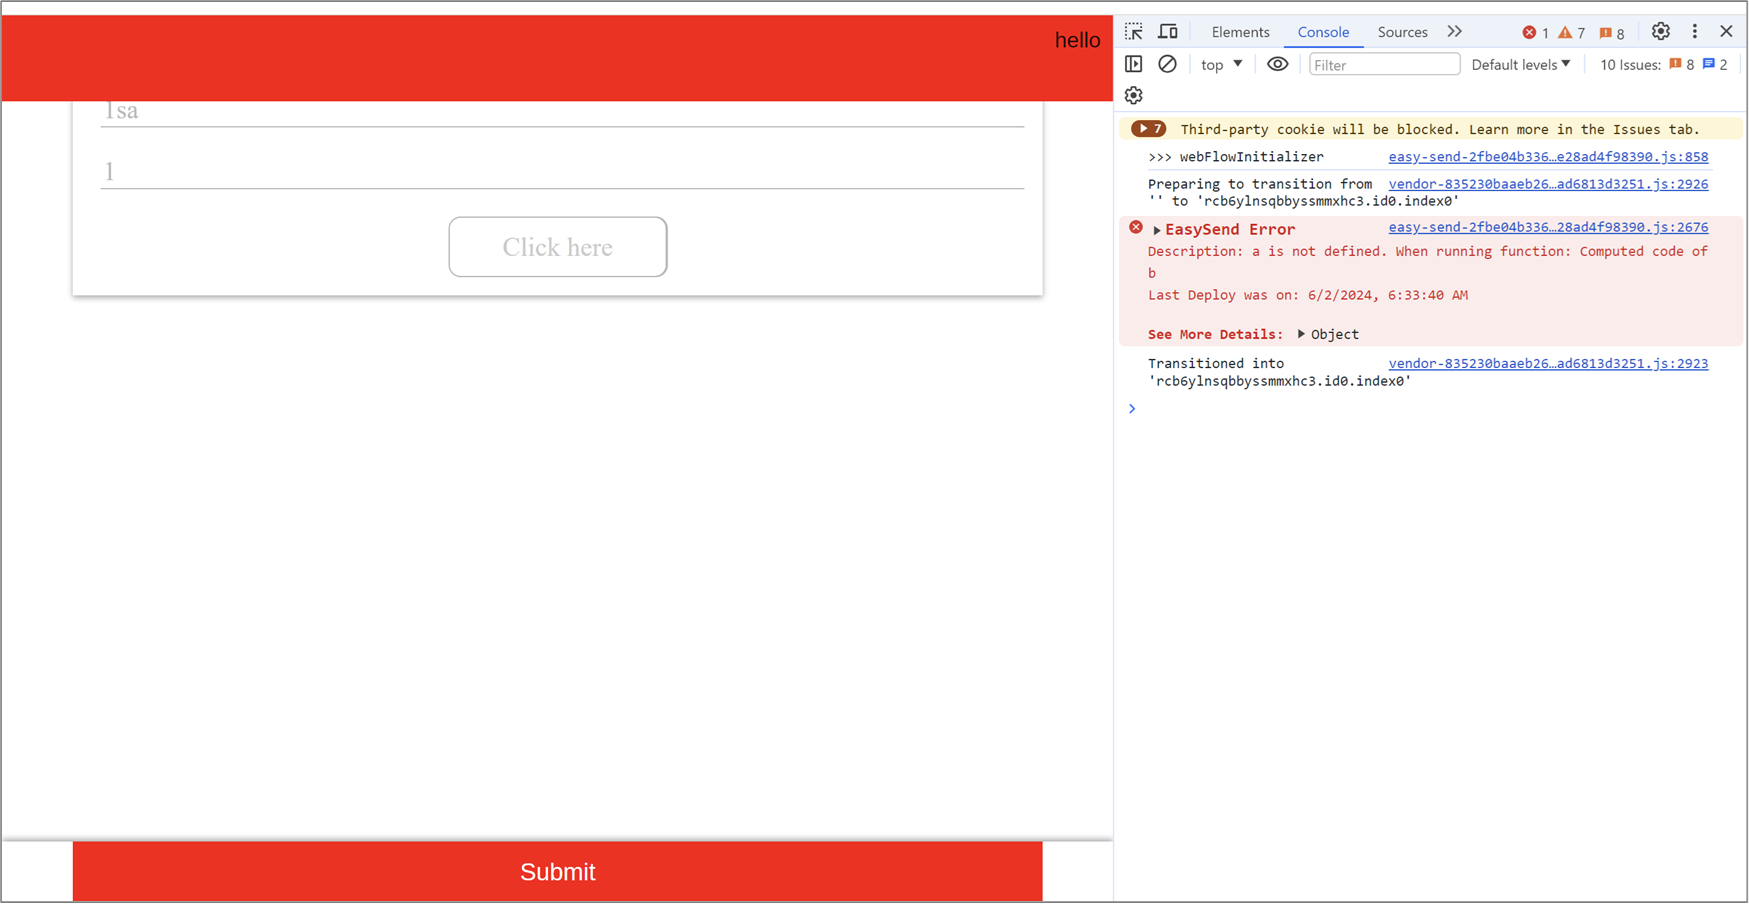
Figure 3: Accessing the Debugger Part 2 of 2
The relevant errors the implementer looks for in the Console are EasySend Errors. In addition to these Errors, the Console contains additional information. That information is not relevant to the EasySend errors and can be distracting. The implementer can use different built-in Console tools to remove irrelevant information, for example:
- Use the Filter field (1) to view only EasySend errors
- Set the default levels (2) to determine what type of information will be displayed
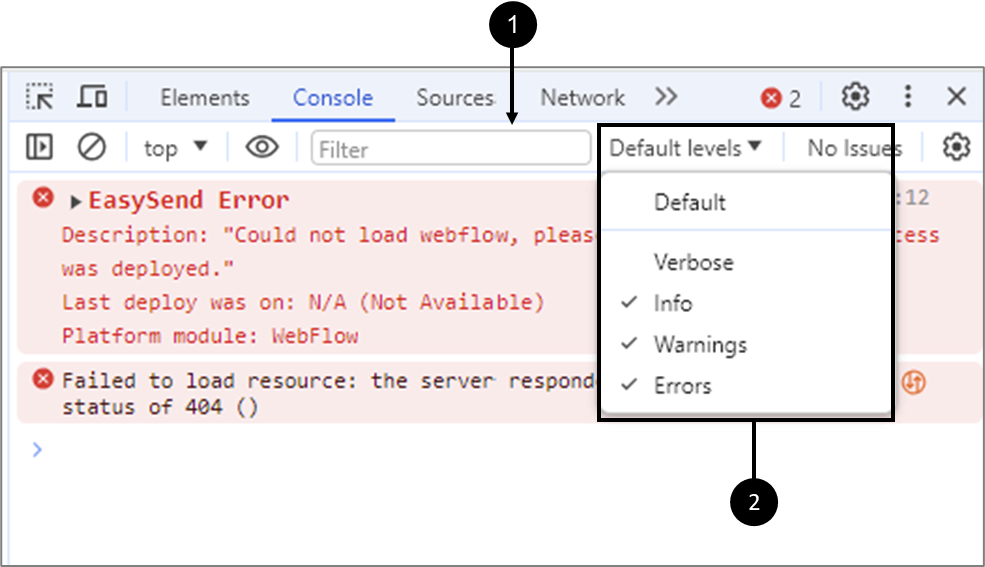
Figure 4: Adjusting Console Information
Viewing and Managing Player Errors
(See Figure 5 to Figure 7)
After accessing the debugger, while interacting with the digital process, Player errors become visible. Each error contains the following information:
- EasySend Error indication (1)
- Detailed description (2)
- Additional details that will appear while clicking the indicator (3)
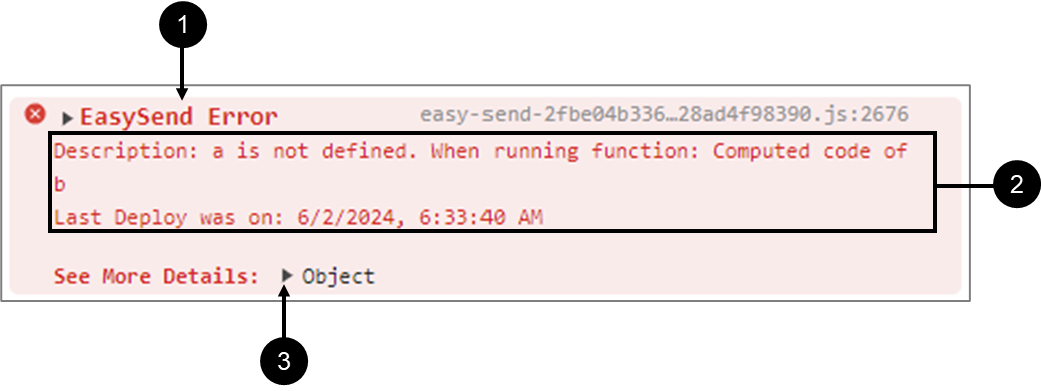
Figure 5: Player Error Example
Clicking the additional details indicator (3) will display more information that varies according to the type of error. In the following example, we are viewing two Player errors. The top Player error was generated in the Model as indicated by the information displayed in the Platform module row (4). The error is connected to a Model data item named b (5). The Model function (6) that triggered the error was Computed.
The expected action from the implementer after discovering this EasySend error is to navigate to the Model, locate the relevant data item, and explore and fix the Computed code.
The bottom Player error was generated in the Webflow as indicated by the information displayed in the Platform module row (7). The error is connected to a form-button Webflow component (8). The Property (9) that triggered the error was action.
The expected action from the implementer after discovering this EasySend error is to navigate to the Webflow, locate the relevant form-button component, and explore and fix the code.
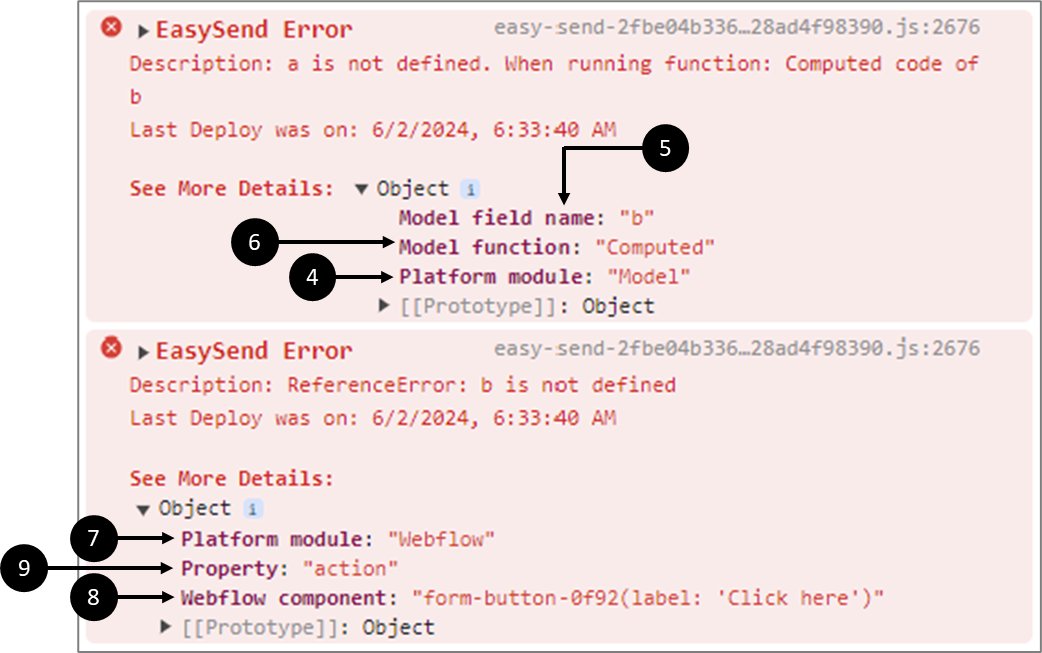
Figure 6: More Details Examples
In another example, according to the Description (10), the implementer can understand that there is an issue with the formula and what exactly is the problem. It is indicated that The Player error was generated in the Model (11). The error is connected to a Model data item named b (12). The Model function (13) that triggered the error was a Formula. It is also indicated that the Used value was empty (14).
The expected action from the implementer after discovering this EasySend error is to navigate to the Model, locate the relevant formula, and explore and fix its code.
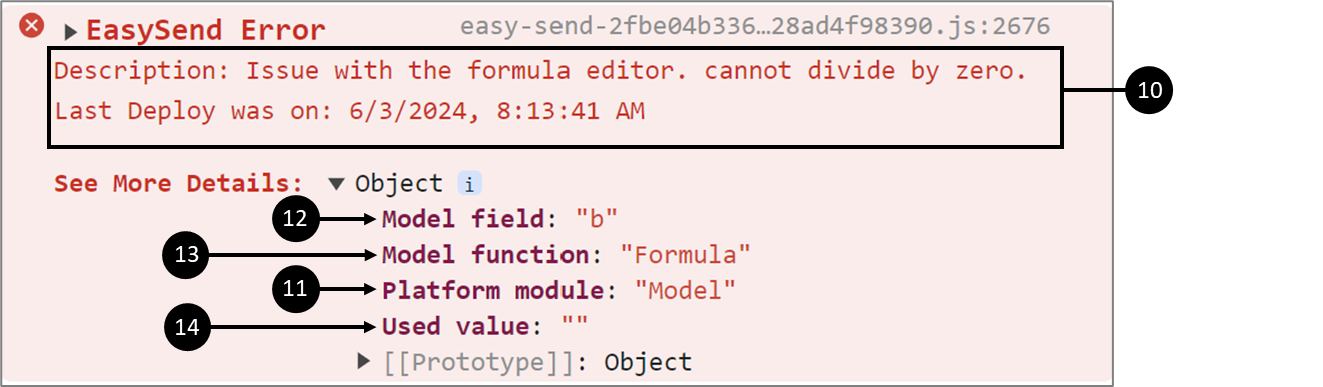
Figure 7: Formula Player Error