Article Overview
The following article describes the structure of the authoring screen.
Accessing the Authoring Screen
To access the authoring screen, perform the following steps:
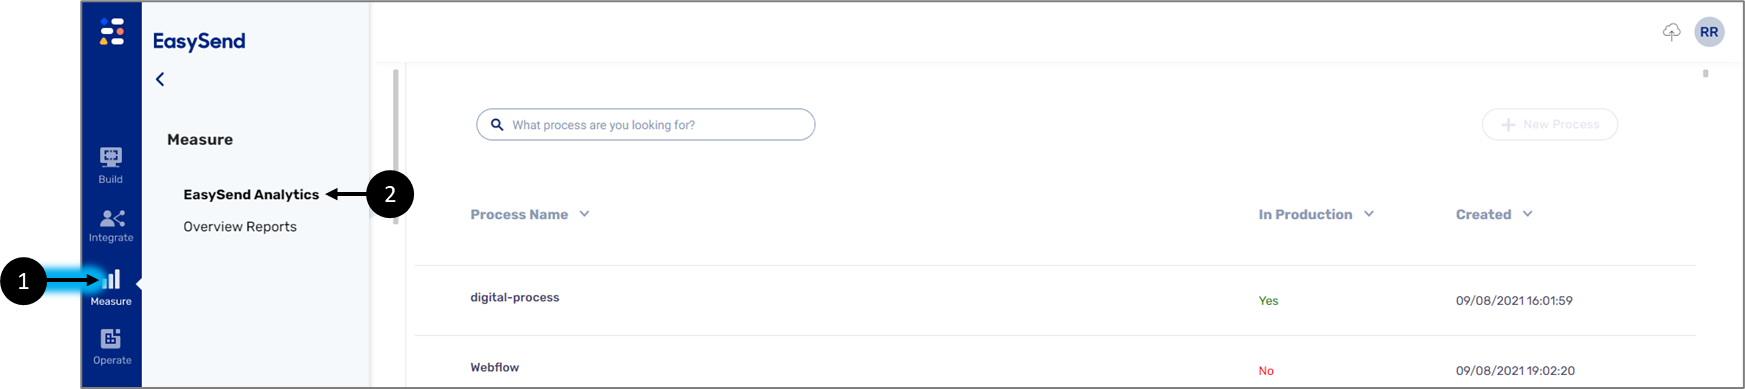
Figure 1: Navigating to EasySend Analytics
- Click Measure (1).
- Click EasySend Analytics (2).
Result:
The EasySend Analytics main screen appears:
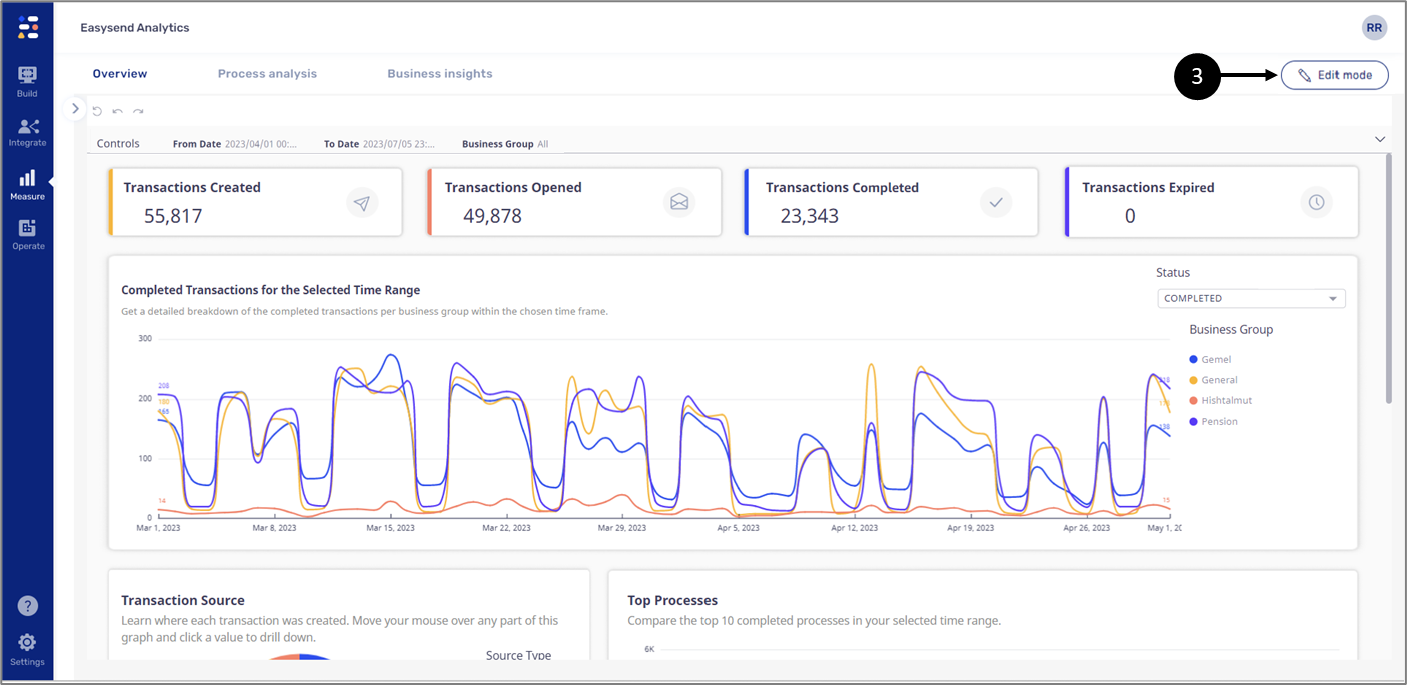
Figure 2: Edit mode Button
- Click the Edit Mode button (3).
Result:
The authoring screen appears.
Authoring Screen Description
Figure 3 and Table 1 describe the structure of the authoring screen.
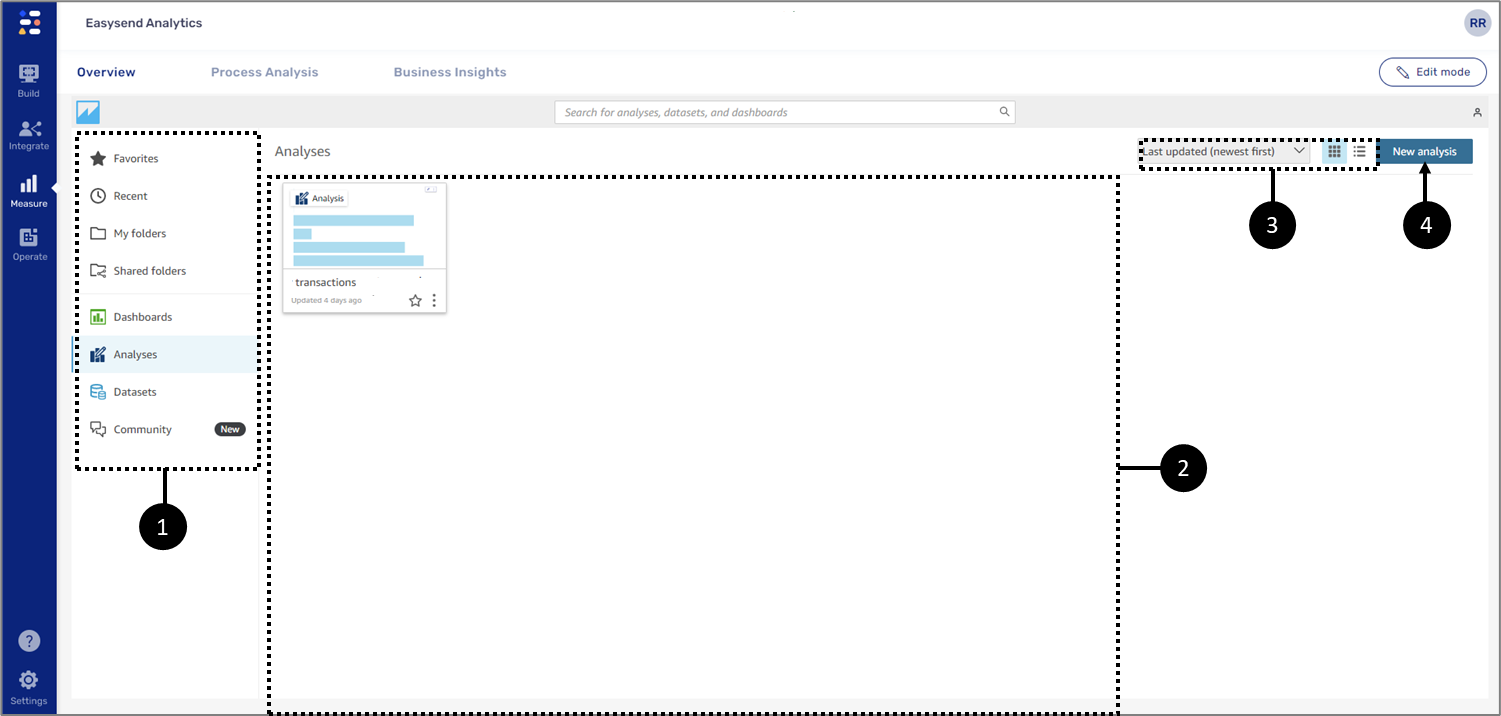
Figure 3: The Authoring Screen
Table 1: The Authoring Screen
Number | Name | Description |
1 | Left Pane | Contains different options such as creating new items, navigating to other screens, and organizing information NOTE For additional information, see the Left Pane options section |
2 | Display Section | Displays information according to a selected option from the left pane |
3 | Display Options | Enables to perform the following actions
|
4 | New analysis | Enables to create a new analysis NOTE
|
Left Pane Options
The left pane contains the following options:
- Search bar - enables searching for different items.
- Favorites - displays analyses and dashboards marked as favorites.
- Recent - displays recently viewed analyses and dashboards.
- My folders - enables to create personal folders for organizing:
- Analyses
- Datasets
- Dashboards
- Shared folders - displays folders that were shared with you. Shared folders are used for sharing published dashboards that will appear under the Business Insights tab.
- Dashboards - displays your dashboards in tiles or a list
- Analyses:
- Displays your analyses in tiles or a list
- Enables you to create a new analysis
- Datasets - displays a list of datasets:
- Your datasets that were created using Model data items from your environment
- Built-in datasets for the Overview and the Process Analysis dashboards
- Community - not covered in this article